


S&P 500, Event Risk, BOJ Decision, GBPUSD and USDJPY Talking Points:
- The Market Perspective: USDJPY Range Below 138 and Bearish Below 133.50; EURUSD Bearish Below 1.0550; GBPUSD Bearish Below 1.2100
- The fundamental drums eased heading into the new trading week, but the S&P 500 extended its slide from last week to stretch from the 20-day moving average while coming into technical support
- A number of Dollar crosses are on the verge of short-term bearish reversals (against the Greenback), but will the market trigger the breaks – much less find follow through?

We have stumbled into the final full week of liquidity for the trading year. Next week’s holiday-shortened period between Christmas and New Years is notorious for its drain in speculative traction. However, we still have potential in the markets before we see the fade into this weekend. While there are still systemic matters that will carry forward trends into 2023 (such as monetary policy standings and recession concerns), it will likely prove very difficult to keep the market moving on this matters without definitive event risk or developments to keep the speculative engine warm. If that is indeed the case, the bouts of volatility that we come across from fundamental or technical sources will likely push short-term technical boundaries or hasten revision-type moves. For the S&P 500, the extended slide from last Tuesday’s post-CPI peak is already substantial and now stands on the treshold of another round of prominent technical barriers. The 3,800 level seems to be the overlay of the October to December midpoint and the 38.2 percent Fib of the August to October bear wave. Further, the pace of the tumble this past week stretches not just the consistency of the market but also the stretch relative to a baseline like the 20-day simple moving average. A snap back (reversion to mean) could be quick, but it wouldn’t be a heavy lift from bulls with an insinuation beyond the range.
| Change in | Longs | Shorts | OI |
| Daily | 1% | -1% | 0% |
| Weekly | 15% | -13% | -1% |
Chart of the S&P 500 with Volume, 100 and 200-Day SMAs, 5 to 20-day ATR Ratio (Daily)
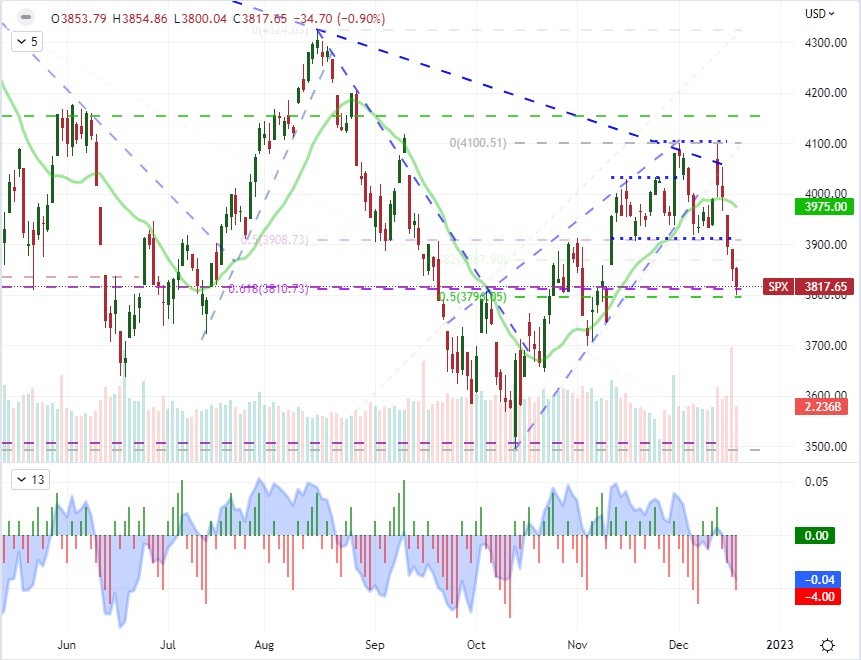
Chart Created on Tradingview Platform
Evaluating the market that we are facing through years end, I find it useful to look at different scenarios from the past that can give perspective to alternative outcomes. Typically, the norms for market performance, volume and volatility (activity levels) are clear from a benchmark like the S&P 500. The month of December has averaged out one of the best performances of the calendar year looking back decades while turnover and volatility naturally abate. However, that is an average; so there will be instances significantly more intense in that lean and those times where we have leaned substantially in the opposite direction. It isn’t difficult to find an instance that conforms. The final two weeks of December from this past year (2021) showed the typical ‘risk on’ charge that accompanied a slump in the VIX volatility index and slide in volume. Notably, the turn of the year invited a very prominent turn in direction – from record highs to the 2022 technical ‘bear market’ we watched unfold. For the atypical, we can wind back to 2018 when the final full week of liquidity showed a sharp decline in the S&P 500 and rally in VIX. Leading into this week, we seem to be more closely aligned to 2018, but that period’s October-November period presented a bearish reversal with elevated volatility.
S&P 500 Highlight of December 2018 and December 2021 Periods (Daily)
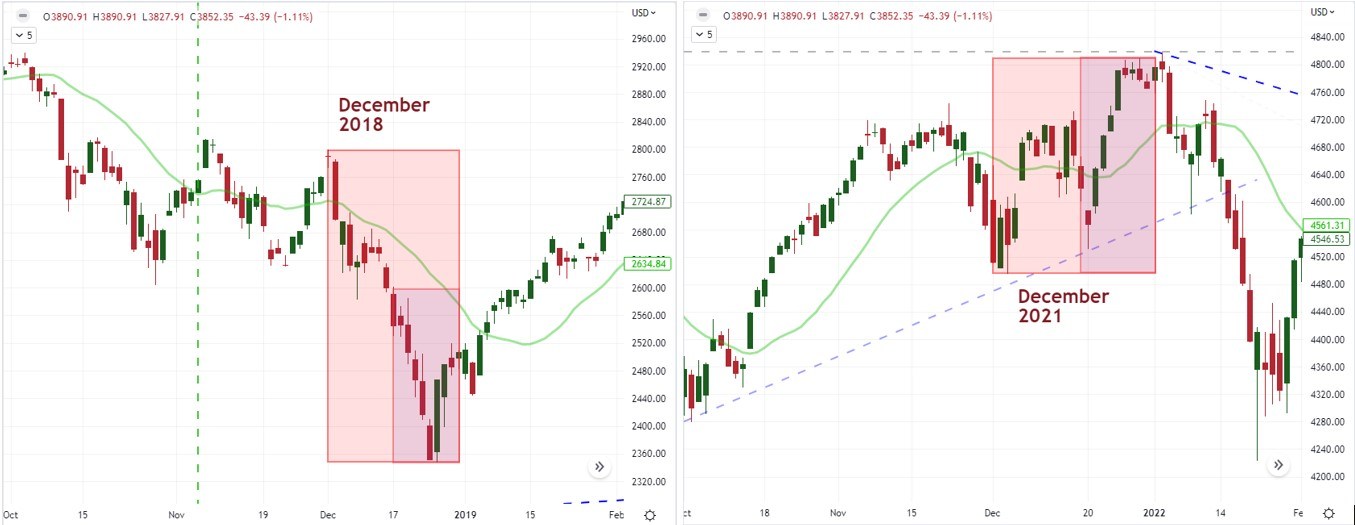
Chart Created on Tradingview Platform
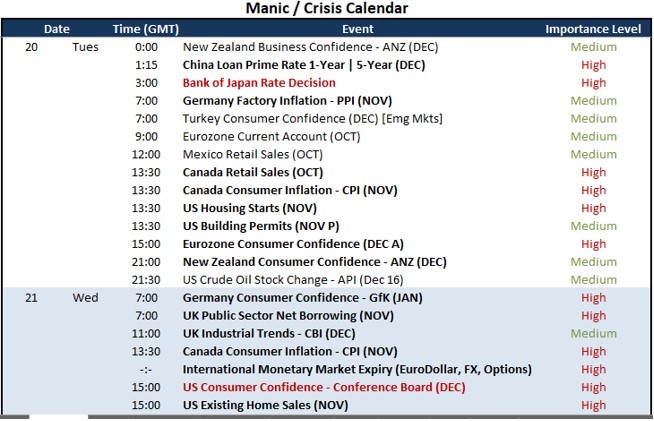
Looking to the economic docket for fundamental sparks that could motivate the risk assets globally or a region in particular, there are a few noteworthy events that are perhaps dubious in market moving potential. During the North American session, the US housing Starts figures for November may add weight to the NAHB housing sentiment index which this past session indicated the sector fell deeper int its supposed ‘recession’ (designated by the same group a few months ago). Canadian consumer inflation and retail sales will be another regional swell to monitor for the Loonie crosses. For the European session, the Eurozone Consumer Confidence survey for December is an important release for holiday spending expectations pressured by uncertainty over Winter energy costs. The top event risk for Tuesday though is the BOJ rate decision.
Top Macro Economic Event Risk for the Next 48 Hours
Calendar Created by John Kicklighter
It is unlikely that the Bank of Japan moves from its extremely accommodative monetary policy mix of an essential zero bound benchmark rate and a stimulus program aimed at keeping the benchmark JGB yield anchored (also referred to as ‘yield curve control’). The expectations are so deeply engrained in the market’s scenario analysis that there is likely to be a severely skewed potential impact situation for the Yen and Japanese market. Given that the BOJ is simply expected to keep its course of counter-trend extreme accommodation indefinitely, a dovish bearing is likely to generate little-if-any response from the market. If they manage to further their dovish creds though, I will look to a pair like CADJPY which sports its smallest 20-day trading day range in 10 months or USDJPY would shift its attention back to a more active Dollar ahead. Alternatively, if there is any sign of a future hawkish move from the Japanese authorities, the potential charge for the JPY could be enormous given the ‘surprise’ quotient. I’ll be watching the likes of USDJPY and AUDJPY for such a possibility – even if highly improbable.
Chart of the USDJPY with 20 and 200-Day SMAs (Daily)
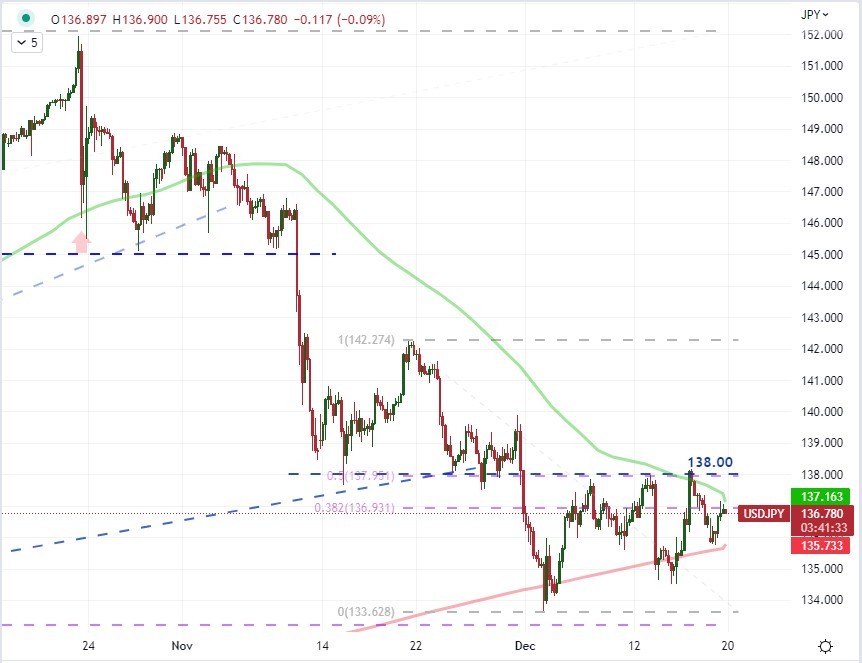
Chart Created on Tradingview Platform
Speaking of USDJPY, the Dollar is generally in a technical position where it is leaning prominently against technical resistance that could trigger a productive rebound after the past weeks’ slide. The Greenback has been under pressure in large part due to the slide in market expectations for Fed intent (despite their efforts to warn they will keep the hawkish pressure) and the general rebound in risk trends that works against its safe haven credentials. There is notable potential for Dollar-favorable breaks for pairs like EURUSD (1.0580), USDJPY (138) and NZDUSD (0.6300). In the Euro and Kiwi counterparts’ case, there is a prominent head-and-shoulders pattern. GBPUSD is no different with the exception with its own H&S following the failed break above the post-pandemic midpoint breakout at 1.2300 and with the ‘neckline’ at 1.2100 coinciding with the 200-day moving average. A break in the Dollar’s favor would be a provocative move and could struggling without a truly prominent data point until Wednesday’s consumer confidence survey from Conference Board, but breaks like these are also in part a move back into established ranges of the past few months. That could be a ‘path of least resistance’ break.
Chart of the GBPUSD with 200-Day SMA (4 Hour)
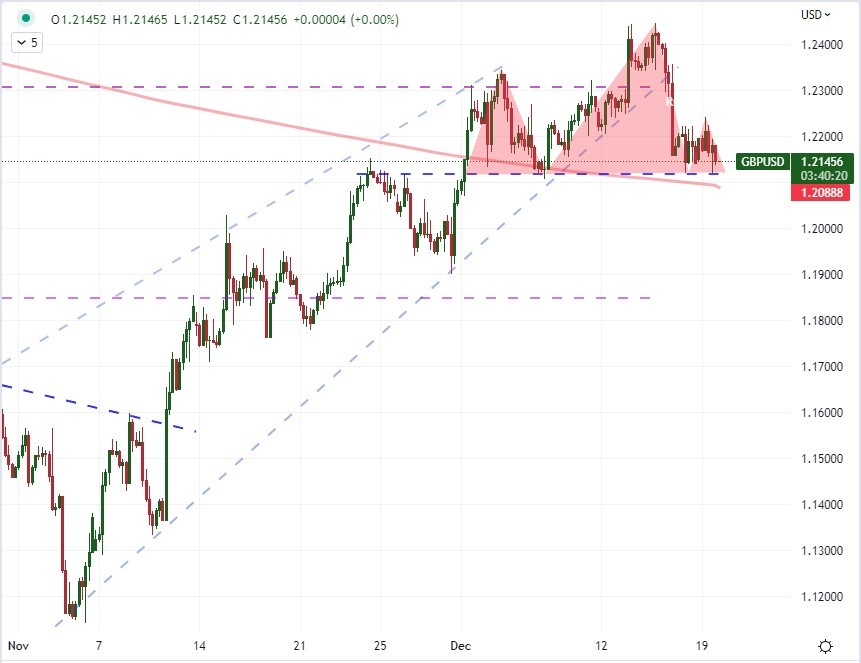
Chart Created on Tradingview Platform
Trade Smarter - Sign up for the DailyFX Newsletter
Receive timely and compelling market commentary from the DailyFX team


