


S&P500 & NAS100 PRICE FORECAST:
- SPX Faces a Host of Challenges as Recovery Hopes are Dashed by Rising US Yields and Poor Tech Earnings.
- Google Parent Alphabet Fell as Much as 8.7% as it Missed Expectations for its Cloud Business as Microsoft Gained 2.3% as it Beat Estimates. Meta and IBM Reporting After Market Close.
- IG Client Sentiment Shows that Retail Traders are Long with 64% of Traders Currently Holding Long Positions on the S&P. Given the Contrarian View to Crowd Sentiment Adopted Here at DailyFX, is this a sign that the SPX may continue to fall?
- To Learn More About Price Action, Chart Patterns and Moving Averages, Check out the DailyFX Education Section.
Most Read: Bitcoin (BTC/USD) Pops Above $35k Before a Pullback, More Upside Ahead?
US Indices have struggled today with both the S&P 500 and Nasdaq 100 testing key levels of support as earnings and a rebound in the US 10Y yield posed obstacles. The S&P struggled to build on a positive close yesterday and is down about 2% for the month of October but it was the NAS100 which lost more ground down as much as 1.8% on the day.
Elevate your trading skills and gain a competitive edge. Get your hands on the US Equities Q4 outlook today for exclusive insights into key market catalysts that should be on every trader's radar.

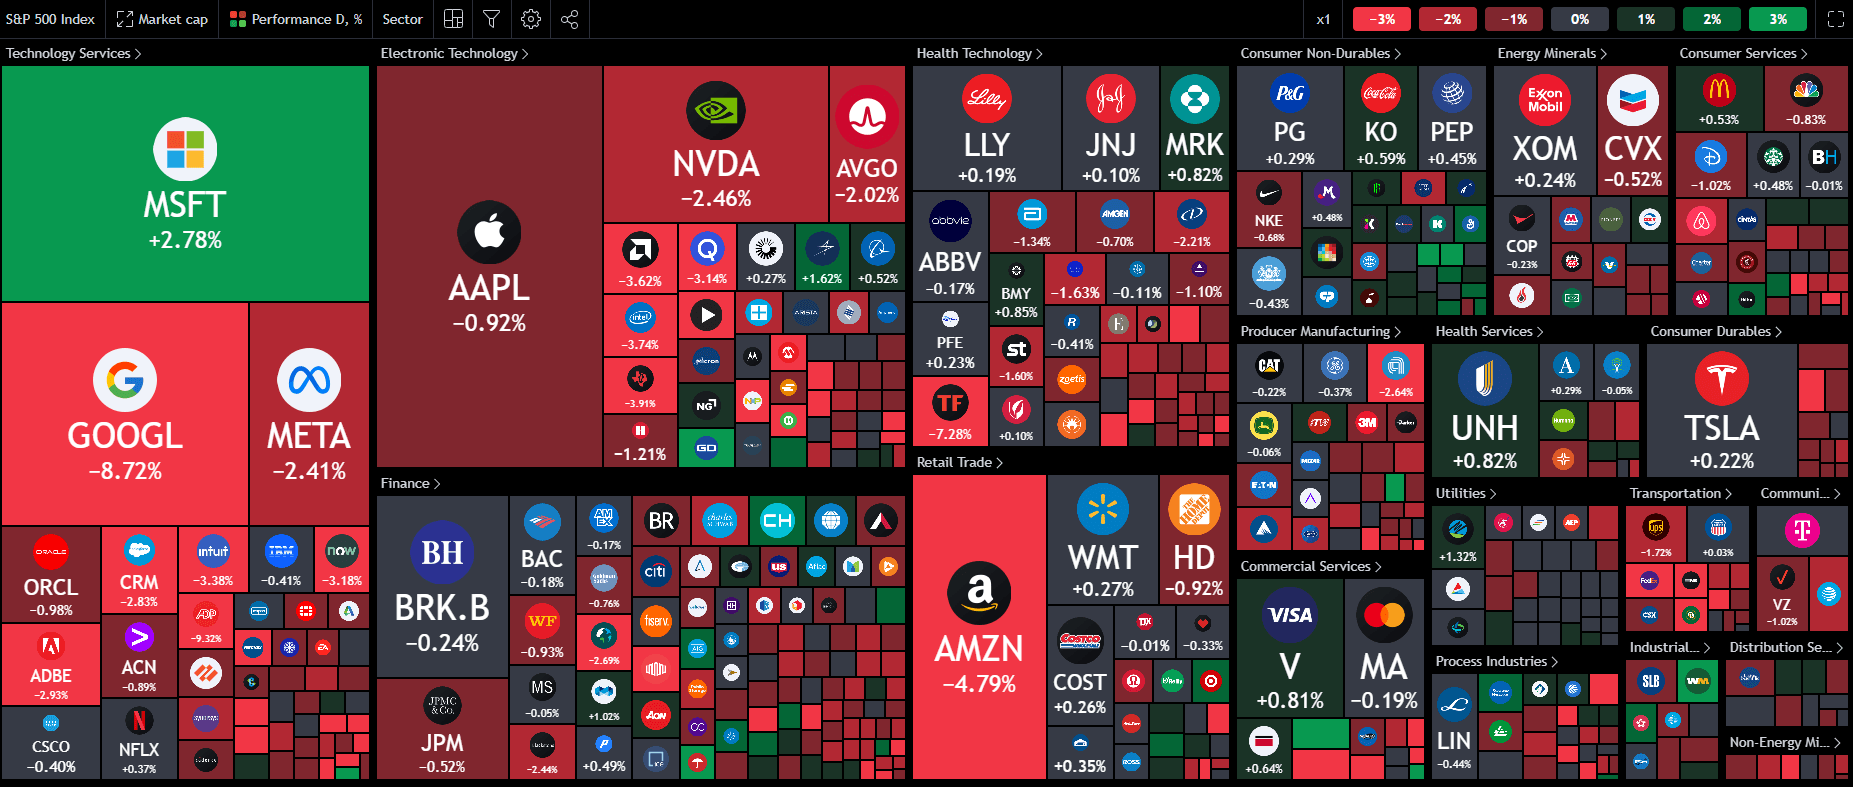
Google parent Alphabet fell around 8.7% as the company’s cloud business continued to slow. In contrast Microsoft saw a rise in its share price of around 2.3% after it beat estimates. Alphabet is now on course for its largest one-day drop in market value ever following todays earnings release. An indication of the importance of the revenue miss of the cloud business is evidenced by the rise in the share price of Microsoft who beat expectations for its cloud business and is enjoying a decent day of gains.
Looking at the Heat Map for the S&P 500 below and we can see the strain markets have been under today as it does not paint a pretty picture. Technology Services is having a bad day across the board with only two stocks in the green for the day with Microsoft and F5 Inc. leading the way.
Source: TradingView
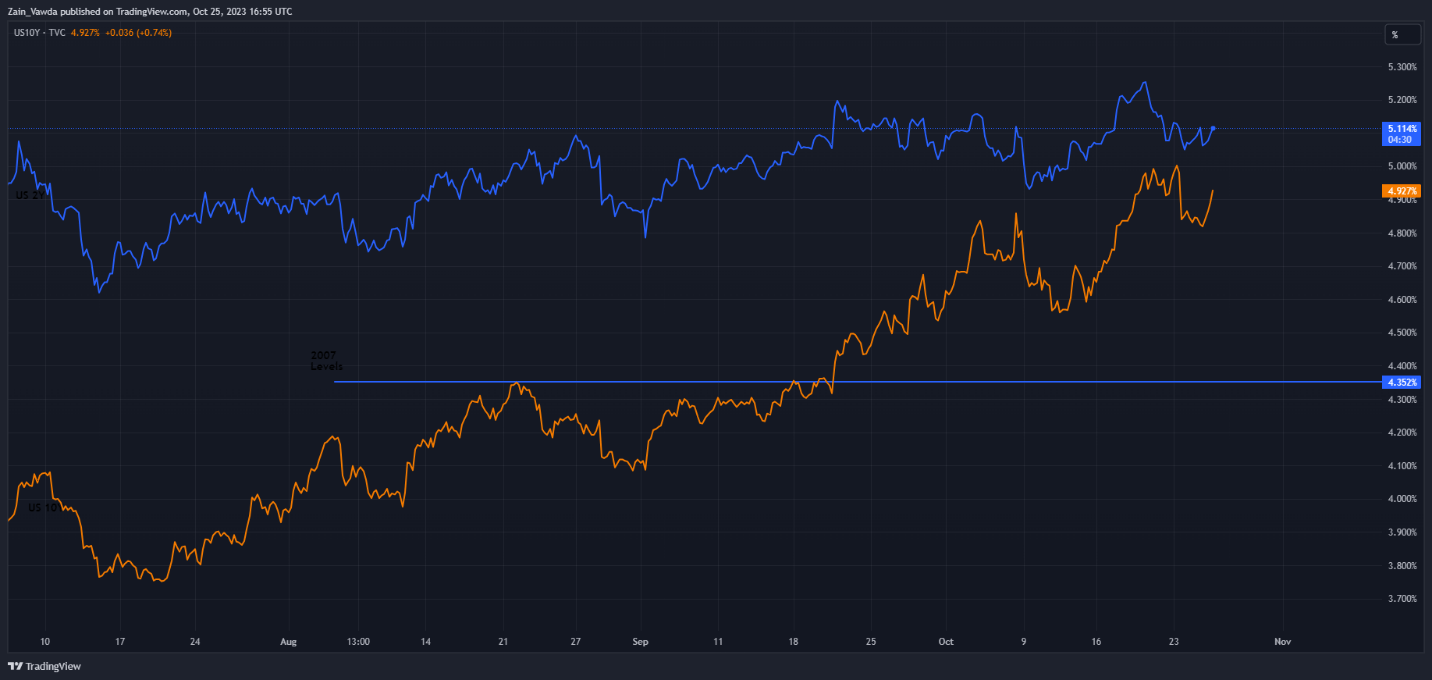
Another factor that has weighed on stocks today has been the resurgence in the 10Y US Treasury Yield. US 10Y Yield has rebounded quite aggressively today in part thanks to better-than-expected US home sales data and followed a selloff yesterday leaving the 10Y Yield at 4.92% at the time of writing.
The US 10Y note is rising at its fastest pace since 1980, with the last 3 years seeing the 10Y note yield rise by some 400bp. To put this into context during the 2008 financial crisis US Treasury Yields only rose at about 50% of the current pace. Are higher rates the new normal?
US 2Y and 10Y Yield Chart
Source: TradingView, Created by Zain Vawda
Looking ahead and it appears that for now the ground offensive into Gaza is on hold which has somewhat put Geopolitical risk on the back burner. This is likely to remain short-lived however and should be monitored moving forward.
Looking for actionable trading ideas? Download our top trading opportunities guide packed with insightful tips for the fourth quarter!

After market close today we do have two tech sector big boys reporting earnings in the US with both Meta and IBM due to release their numbers. Meta in particular being a massive player could have a material impact on the moves in Equity futures overnight and also have a knock-on effect to equities in the APAC region.
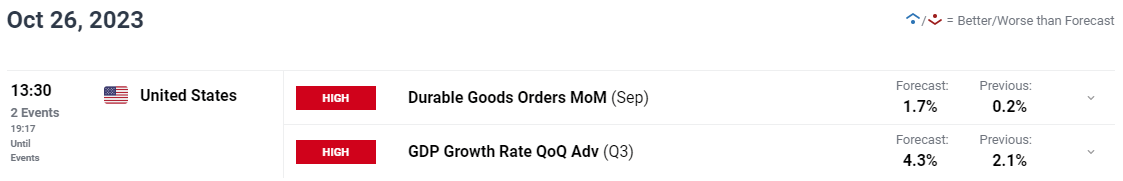
Looking ahead and tomorrow we have the prelim Q3 GDP numbers from the US which is expected to come in hot given the strength of the US economy during the last quarter. A major beat or miss here could have a definite impact on overall sentiment heading into the US session and could be a driving force if the Geopolitical situation remains relatively unchanged.
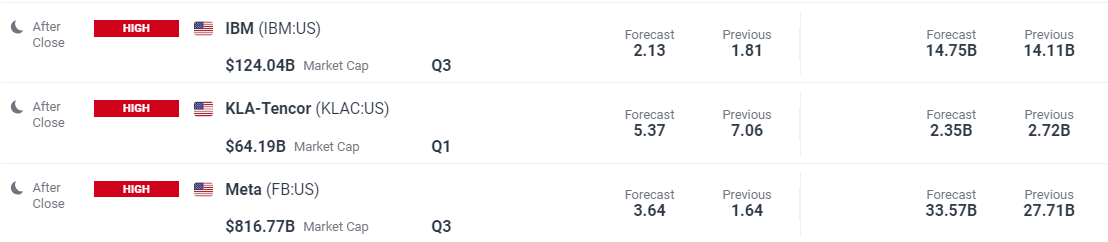
For all market-moving earnings releases, see theDailyFX Earnings Calendar
S&P 500 TECHNICAL OUTLOOK
Form a technical perspective, the S&P is now flirting with a key area of support at the 4200 mark. The 200-day MA remains a major stumbling block to any potential recovery for the SPX and as mentioned previously it has been a number of months since the Index has traded below the 200-day MA. For now, a daily candle close is needed below the 4200 mark if we are to see further downside and a potential retest of the 4000 mark.
There is a bit of support on the downside with 4168 the first area of interest as it was the May 31 swing low before the 4120 mark comes into focus. Quite a bit of hurdles for the SPX to navigate if it is to return to the 4000 mark in the coming days and weeks.
Key Levels to Keep an Eye On:
Support levels:
- 4200
- 4168
- 4120
Resistance levels:
- 4248
- 4295
- 4325
S&P 500 October 25, 2023
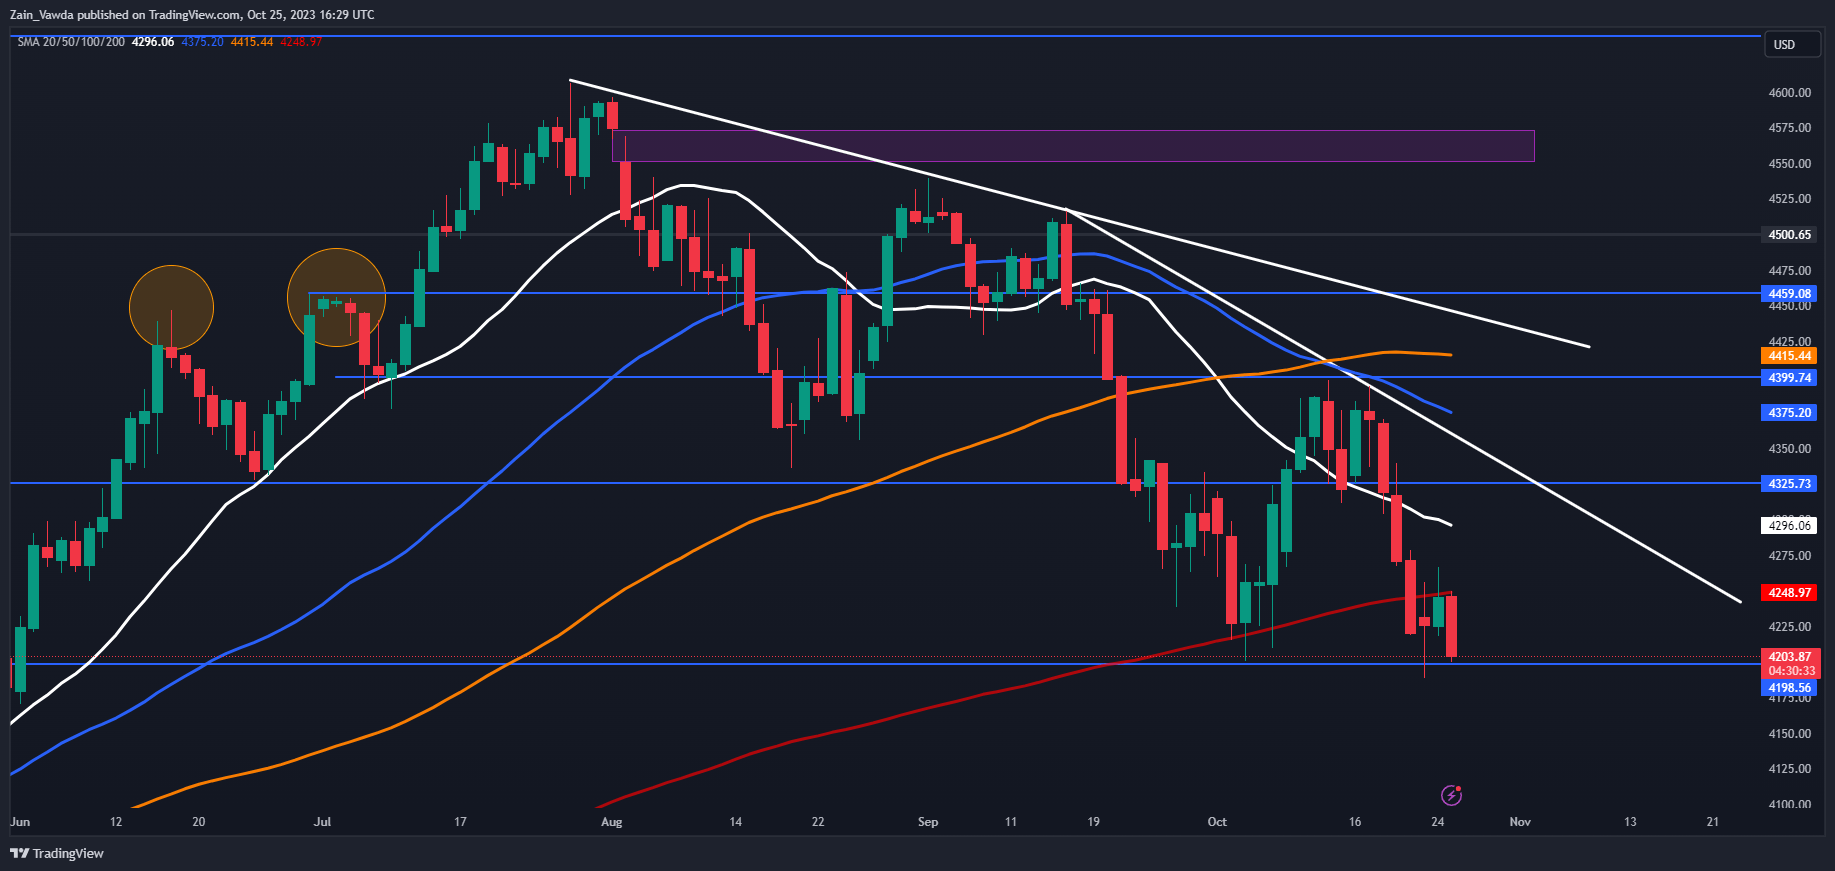
Source: TradingView, Chart Prepared by Zain Vawda
NASDAQ 100
Looking at the Nasdaq 100 and the selloff has been more severe as the largest losses for the day appear to be coming from Megacap tech stocks. Meta reporting after market close could help the Nasdaq in afterhours trade to arrest the slide but a poor report from Meta could send the NAS100 further into the doldrums.
The Technical picture is similar to the SPX as the NAS100 is testing a key area of support around the 14500 mark. a daily candle close below could be the start of a larger downside move opening up a potential retest of the 200-day MA around the 14000 mark. Immediate support rests at 14228 before the 200-day MA comes into focus and could help the NAS100 put in a short-term retracement before falling back toward the 14000 handle.
Key Levels to Keep an Eye On:
Support levels:
- 14228
- 14000
- 13750
Resistance levels:
- 14540
- 14871
- 15000
NAS100 October 25, 2023
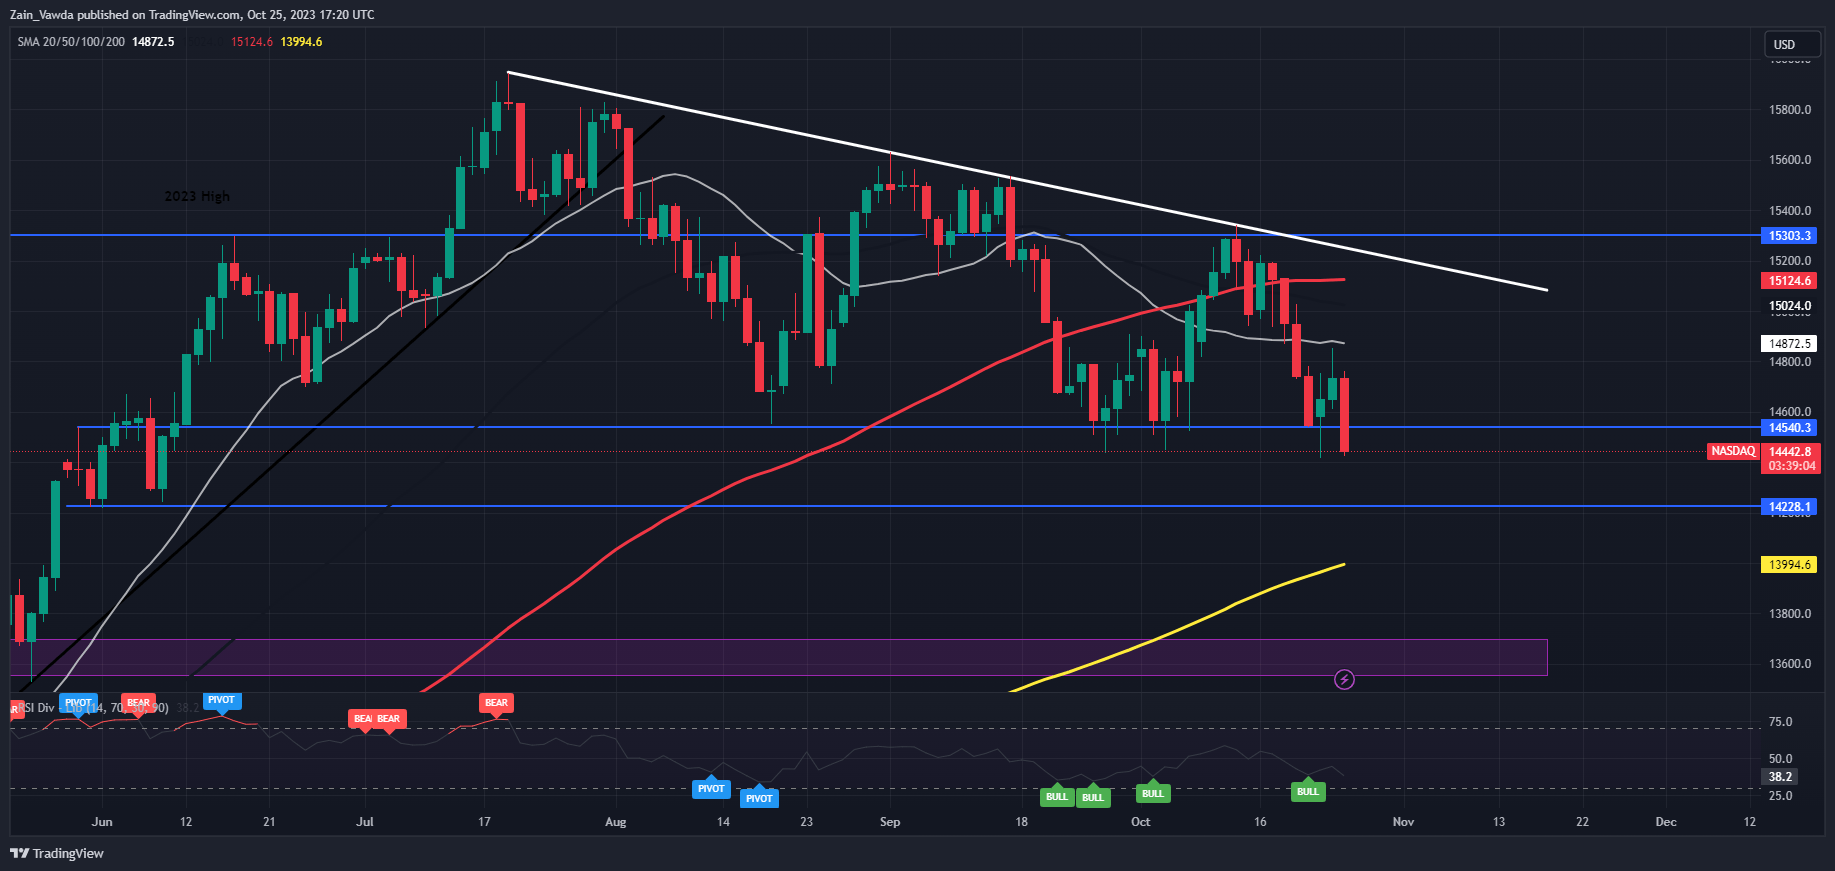
Source: TradingView
IG CLIENT SENTIMENT
Taking a quick look at the IG Client Sentiment, Retail Traders have shifted to a more bullish stance with 64% of retail traders now holding long positions. Given the Contrarian View to Crowd Sentiment Adopted Here at DailyFX, is this a sign that the SPX may continue to fall?
For a more in-depth look at Client Sentiment on the SPX and how to use it download your free guide below.
| Change in | Longs | Shorts | OI |
| Daily | 5% | 3% | 4% |
| Weekly | -17% | 12% | -3% |
Written by: Zain Vawda, Markets Writer for DailyFX.com
Contact and follow Zain on Twitter: @zvawda


