


Gold, Silver Analysis
- Gold continues the bullish pullback as USD heads lower, but US yields rise
- Silver turns higher at influential Fibonacci level
- The analysis in this article makes use of chart patterns and key support and resistance levels. For more information visit our comprehensive education library

Gold (XAU/USD) Continues the Bullish Pullback
Gold is on track for posting a third successive gain after an impressive $155 decline (top to bottom) which lasted all of February. The move comes on the back of rather choppy USD price action over the last three trading sessions with today’s move appearing destined for a lower close. A move higher in gold is typically consistent with a move lower in the dollar but both the US 2-year and 10-year treasury yields rose considerably higher.
Inverse Relationship Between Gold (Yellow) Prices and 10-Year US Treasury (Blue) Yields
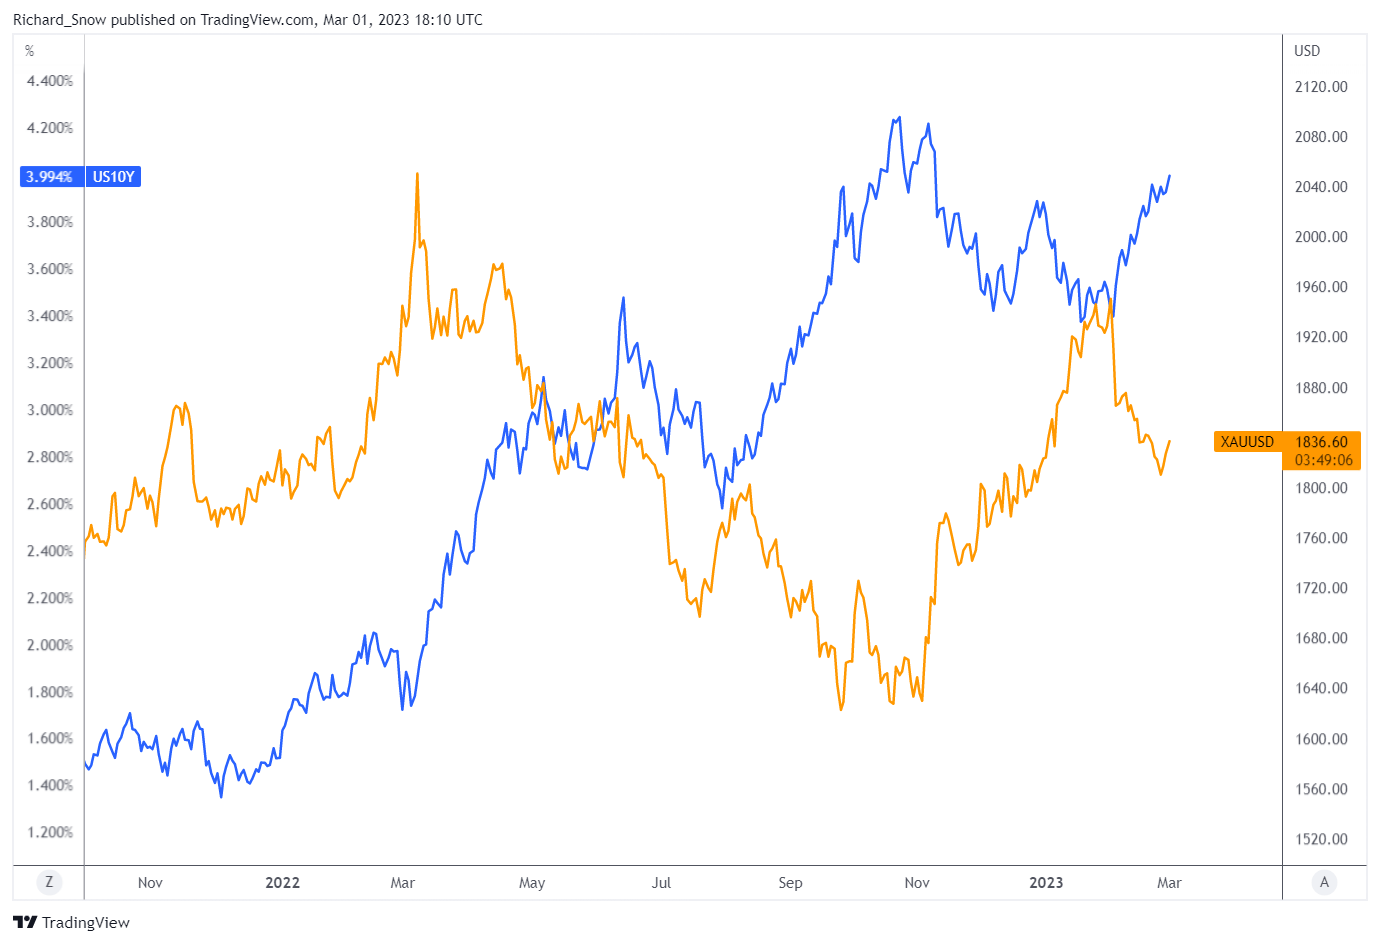
Source: tradingview
As such the current move could simply be a chance for gold bears to take some money off the table ahead of that psychological level of 1800, which sparked a move higher. The daily price action brings the 1833 level back into focus as a close above it, may suggest the pullback has further to run, especially now that the stochastic indicator has moved out of ‘oversold’ territory.
Gold (XAU/USD) Daily Chart
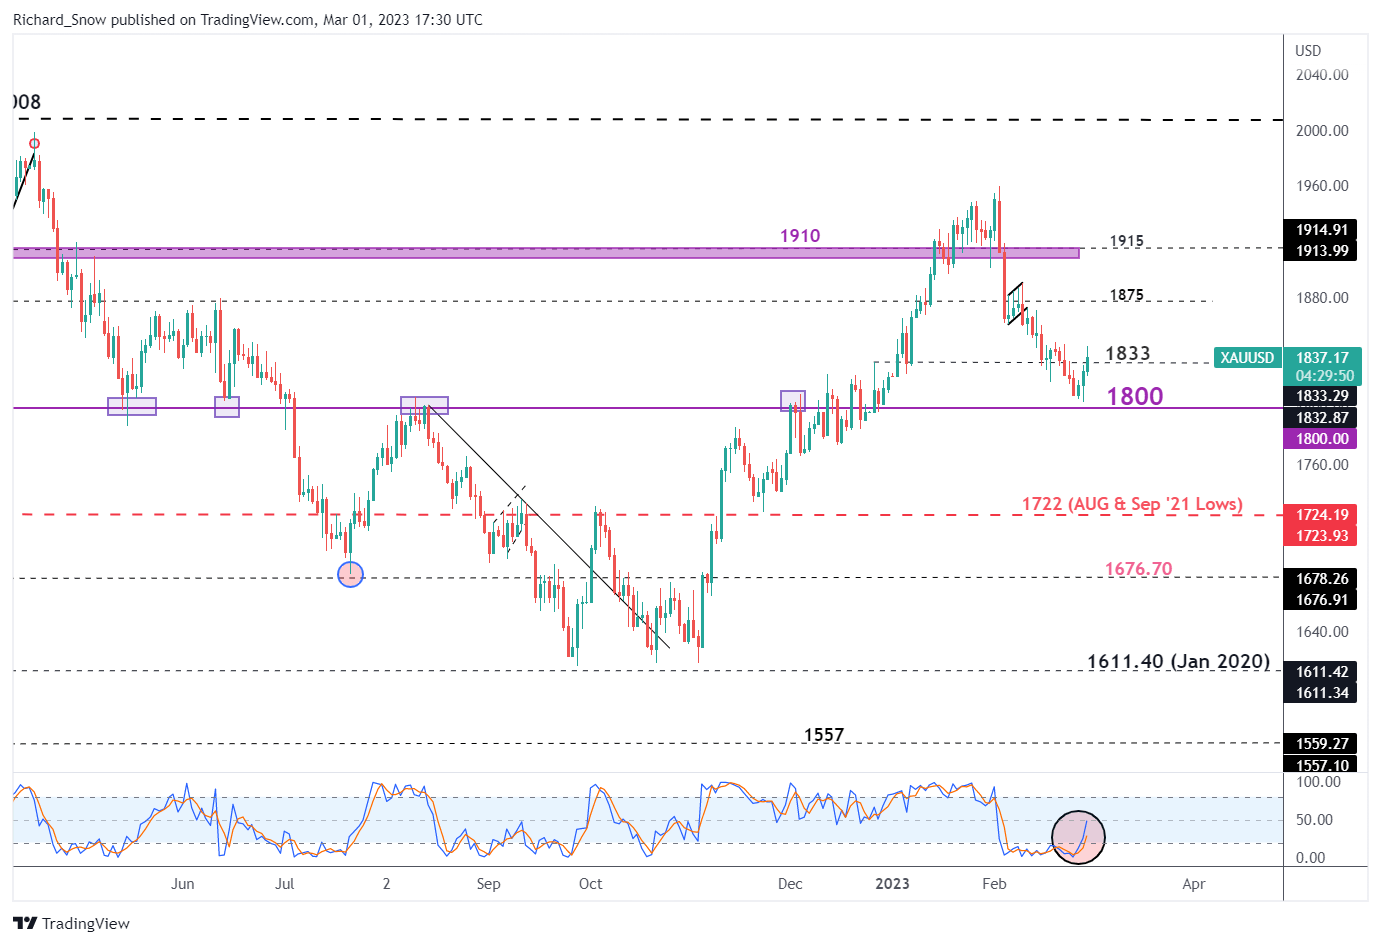
Source: TradingView, prepared by Richard Snow
The 4-hour chart is a great example of how a textbook pattern can play out in financial markets. Sometimes the path of price action differs to what is shown in technical analysis textbooks, and after following the bearish flag formation in gold, its fair to say this is a prime example of how things can look different in reality but still produce the same result. The textbook bear flag contains a sharp sell-off, followed by the rising consolidating ‘flag’ and ends with a similar sharp sell-off. This time the final sell-off was rather measured and took more time to get the projected level around 1800.
A continuation of the longer-term bear trend remains in play should price action dip and close beneath 1833. From there, support comes in at 1800, followed by 1722 which is a fair distance away from current levels. The possibility of an extended bullish move can be assessed above the 1847/50 level.
Gold 4-Hour Chart Showing how the Bear Flag Played out
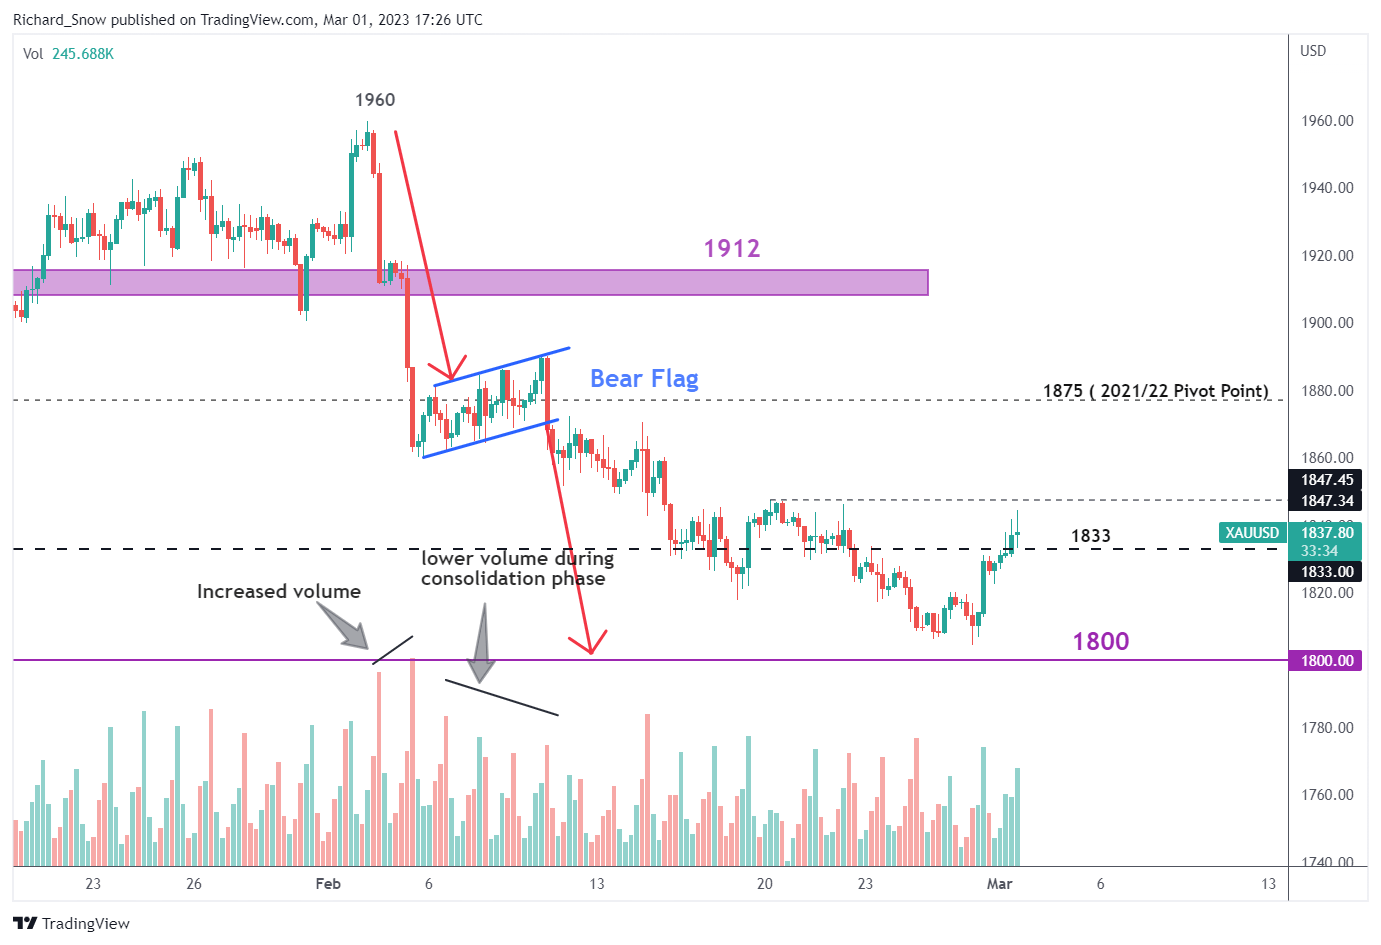
Source: TradingView, prepared by Richard Snow

Silver (XAG/USD) Turns Higher at Influential Fibonacci Level
Unsurprisingly, silver has exhibited many of the same traits as gold has in the previous trading sessions. The weekly chart below helps frame the current move in the broader scheme of things and helps provide perspective of influential zones of support and resistance. The chart shows how influential the (21.40-22.10) zone of support has been for silver from late 2020 into 2021 and 2022. More importantly however, the 23.6% Fib retracement of the major 2021 to 2022 move appears to be where silver bulls have found value.
Silver Weekly Chart
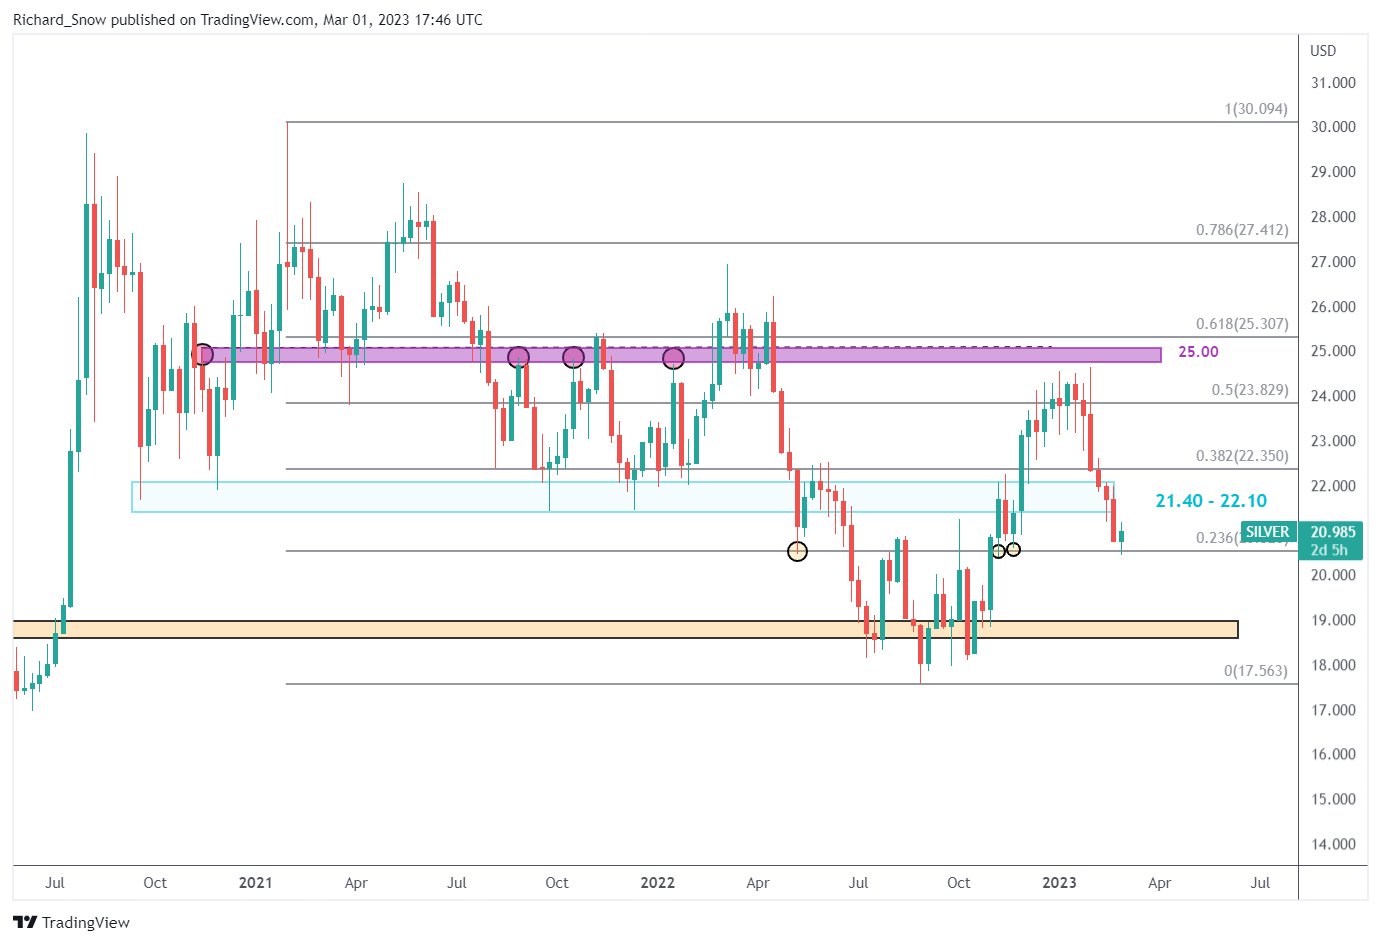
Source: TradingView, prepared by Richard Snow
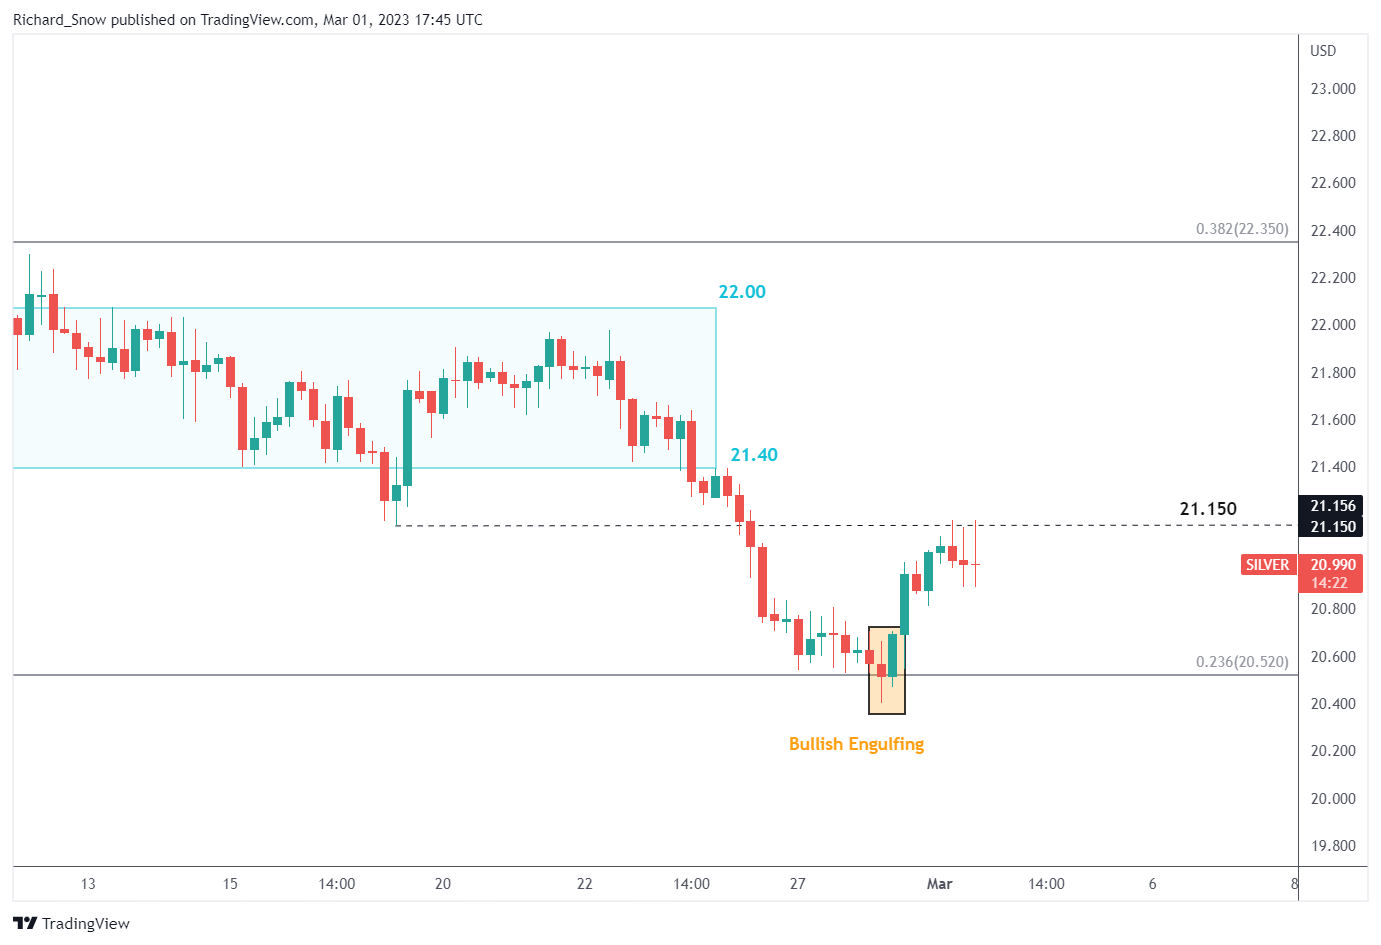
The 4-hour chart helps navigate the shorter-term direction with an immediate hurdle at 21.15, which has seen price action head lower, evidenced by the longish upper wicks. The bullish engulfing at the significant Fibonacci level adds weight behind the move but the potential for a deeper bullish retracement will have to be assessed after surpassing the 21.40-22.10 major zone. Near-term support lies at the turning point (23.6% Fib).
Silver 4-Hour Chart
Source: TradingView, prepared by Richard Snow
Trade Smarter - Sign up for the DailyFX Newsletter
Receive timely and compelling market commentary from the DailyFX team
--- Written by Richard Snow for DailyFX.com
Contact and follow Richard on Twitter: @RichardSnowFX


