


Gold Price (XAU/USD), Chart, and Analysis
- Gold remains stuck in a tight weekly range.
- Further consolidation may confirm a bullish technical pattern.

Gold is sitting in the middle of this week’s narrow range with little on today’s docket to help fuel a breakout. Next week’s calendar is also light on economic data and events with the week in the US also shortened by Thursday’s Thanksgiving holiday and Friday’s Black Friday event. With a lack of drivers, gold may well stay rangebound in the days ahead.
For all market-moving data releases and events, see the DailyFX Economic Calendar.
The precious metal has been on a roll of late, boosted by US dollar weakness. The greenback is showing signs of strength at its current level, aided in part by elevated short-dated US Treasury yields. Hawkish commentary on Thursday by Fed member James Bullard has reinforced these yields. Bullard said that the policy rate is ‘not yet in a zone that may be considered sufficiently restrictive’ before adding that the proper zone for the fed fund rate could be ‘in the 5%-7% range’. The one-year UST is quoted at 4.73%, and the two-year is quoted at 4.48%, with both issues near multi-year yield highs.
Gold Price Rallies Further on US Dollar Weakness, Resistance Lies Ahead

The daily gold chart is showing signs of a potential bullish flag formation, a technical set- p that suggests that gold may push higher. If this set-up plays out then gold is expected to break through resistance just above $1,800/oz. leaving horizontal resistance at $1,879/oz. as the next target. As with a range of markets, price action in the US dollar will decide gold’s fate.
Gold Daily Price Chart – November 18, 2022
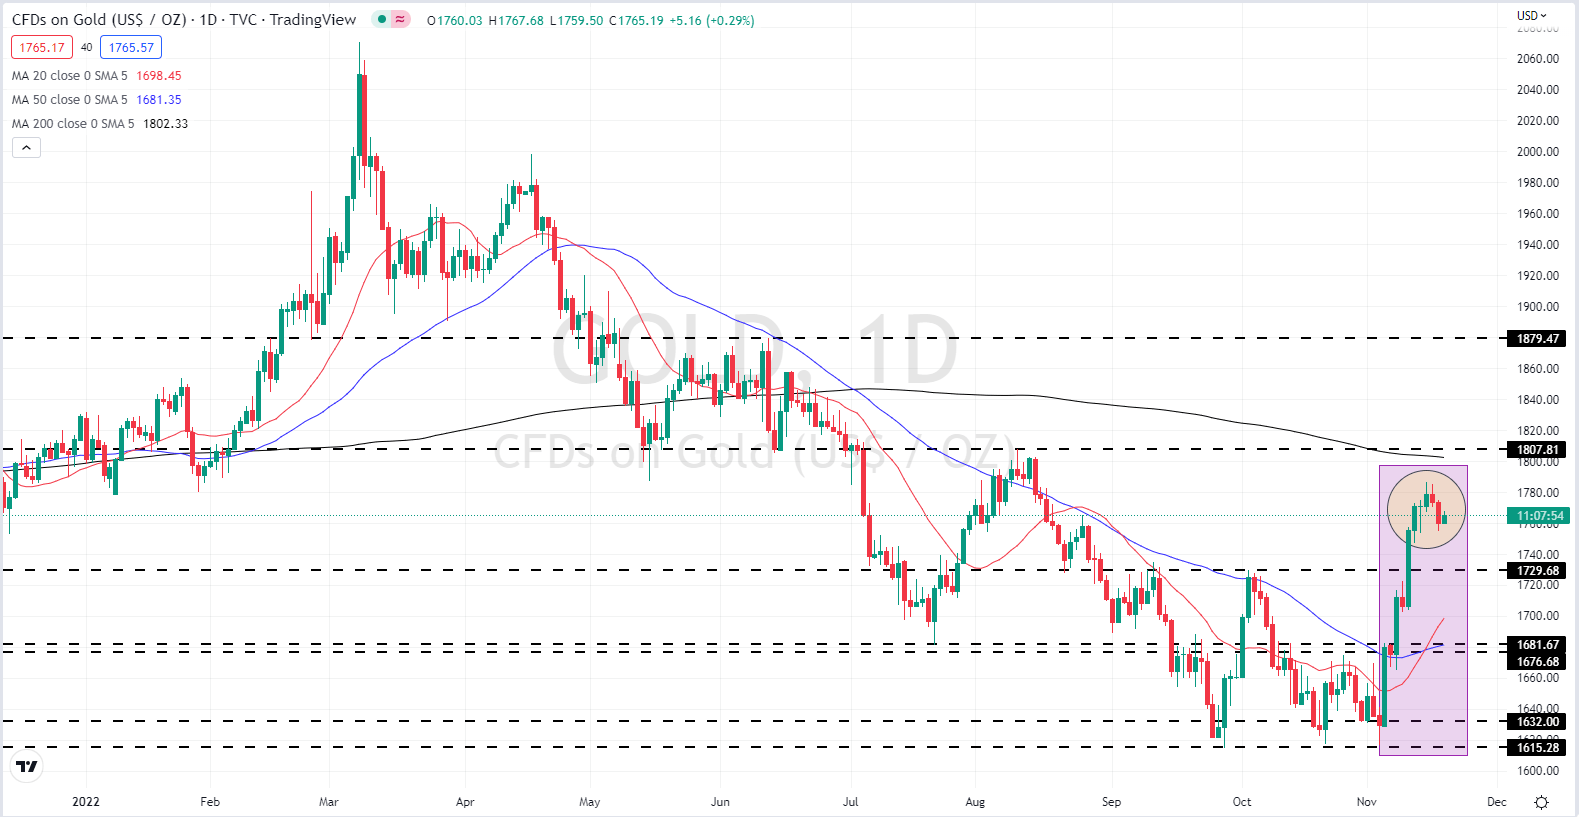
Chart via TradingView
| Change in | Longs | Shorts | OI |
| Daily | 1% | -3% | -1% |
| Weekly | 2% | -8% | -2% |
Retail trader data show 67.11% of traders are net-long with the ratio of traders long to short at 2.04 to 1.The number of traders net-long is 0.18% lower than yesterday and 5.43% lower from last week, while the number of traders net-short is 8.93% higher than yesterday and 31.31% higher from last week.
We typically take a contrarian view to crowd sentiment, and the fact traders are net-long suggests Gold prices may continue to fall. Yet traders are less net-long than yesterday and compared with last week. Recent changes in sentiment warn that the current Gold price trend may soon reverse higher despite the fact traders remain net-long.
What is your view on Gold – bullish or bearish?? You can let us know via the form at the end of this piece or you can contact the author via Twitter @nickcawley1.


