


DAX 40, FTSE 100 Talking Points
- DAX 40 futures break long-term resistance as equity resilience holds.
- FTSE recovers from recent setback, but a rejection of the week signals solid resistance.
- Inflation and interest rate expectations continue to rise, how much is priced in?

Dax Futures Shake-off Christine Lagarde’s Hawkish Tone as Prices Break Prior Fibonacci Resistance
Dax futures hit their highest level in 23-weeks after the seven-week rally drove the major German stock index to a high of 14474 earlier today.
After rising over 20% since the October low, a series of doji candles highlighted indecision and a firm zone of resistance throughout the week. With today’s move allowing Dax 40 to rise above the 14430 level, the 23.6% Fibonacci of the 2020 – 2021 move has shifted from resistance to support.
German Dax 40 Futures Daily Chart
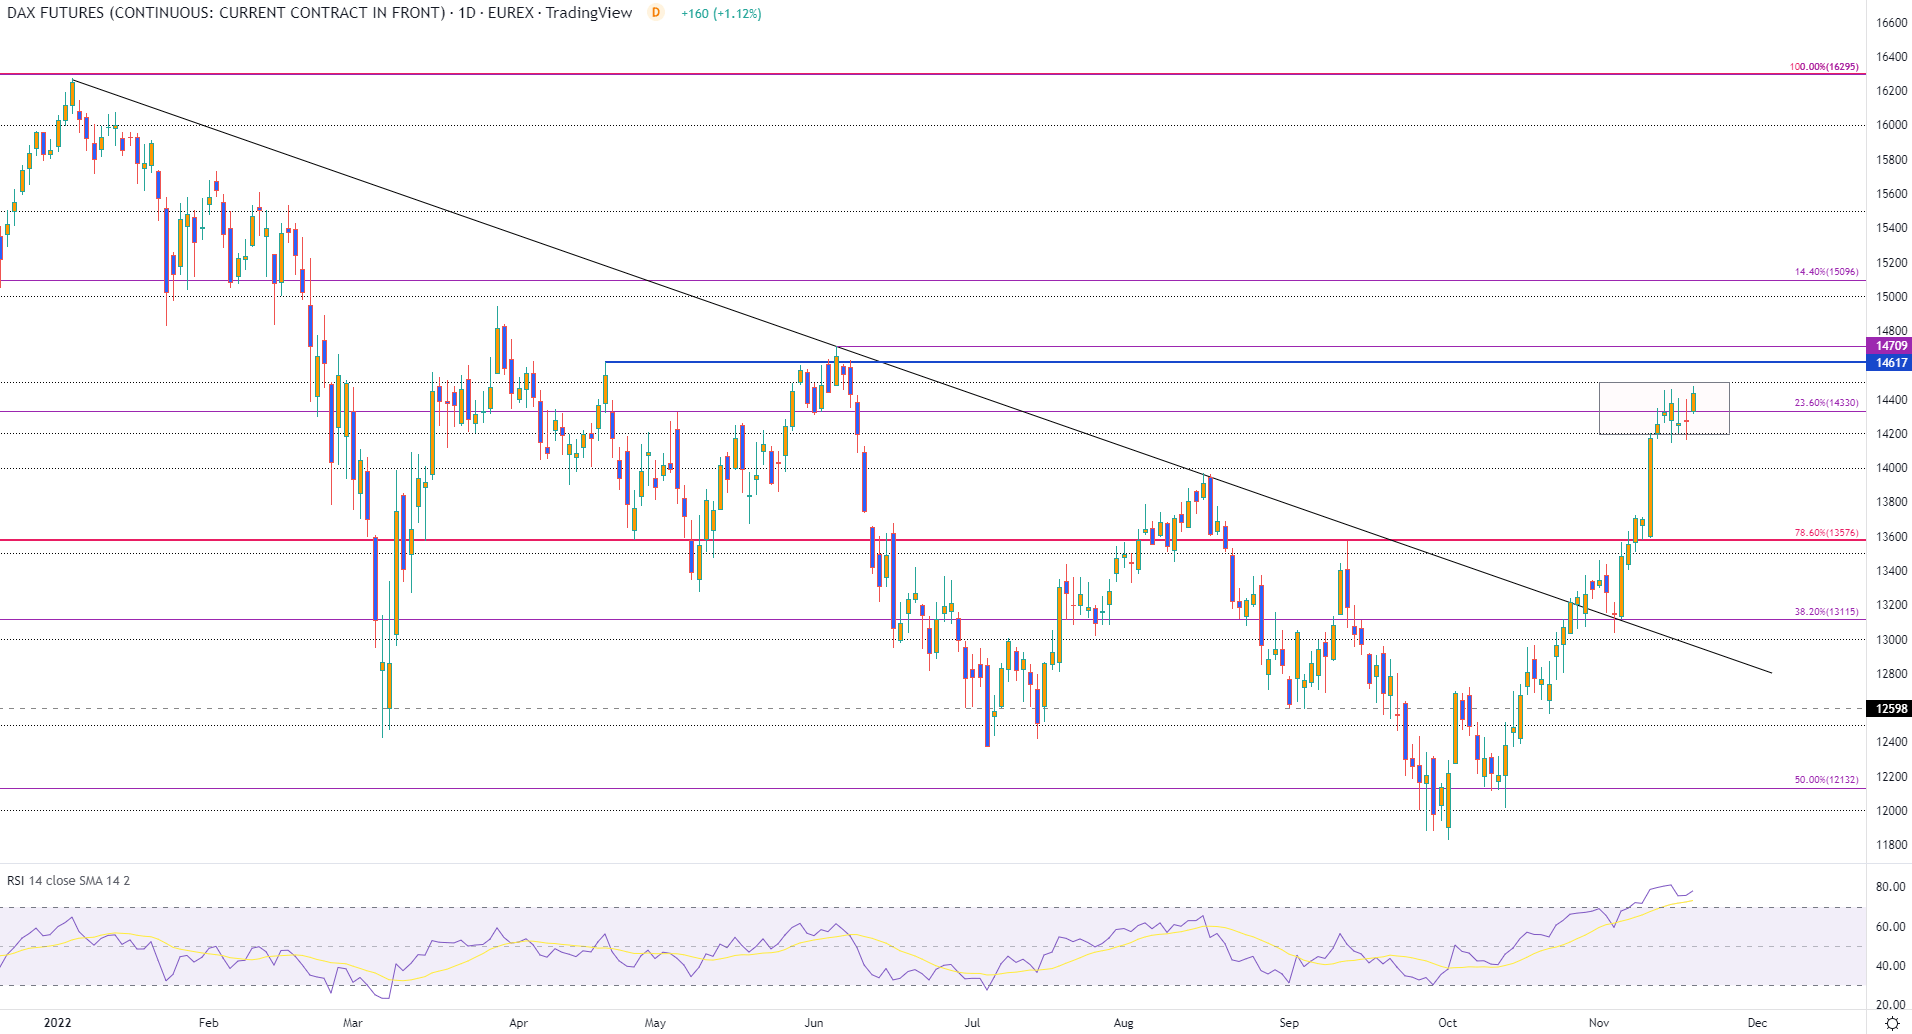
Chart prepared by Tammy Da Costa using TradingView
As central banks express their intent to continue to raise rates until inflation shows significant signs of easing, China’s reopening continues to drive risk assets.
With a 50-bps expected to be announced at the December FOMC (Federal Open Market Committee), ECB (European Central Bank) president Christine Lagarde echoed the Fed’s hawkish rhetoric. As interest rates remain ‘the most effective tool for shaping policy’, yield inversion continues to signal warnings of a potential recession.
However, with the 14500 psychological level and the April high of 14709 coming in as resistance, failure to break these zones could see prices fall back towards 14330. As the daily RSI (relative strength index) remains in oversold territory, the 50-week MA (moving average) is providing additional support at 13963.

FTSE 100 Technical Analysis
For the FTSE 100, the gloomy UK outlook and amendments to the UK fiscal statement have placed additional pressure on growth forecasts.
While the future remains rather uncertain, FTSE 100 pulled back temporarily in yesterday’s session before rebounding off 7294.75. With today’s price action lifting the UK 100 above 7400, a rejection of the upper wick suggests that bulls may be losing steam.
For the uptrend to continue, a rise above the daily high of 7243.51 could see prices head towards the 88% Fibonacci of the August to October move at 7474.3.
FTSE 100 Daily Chart
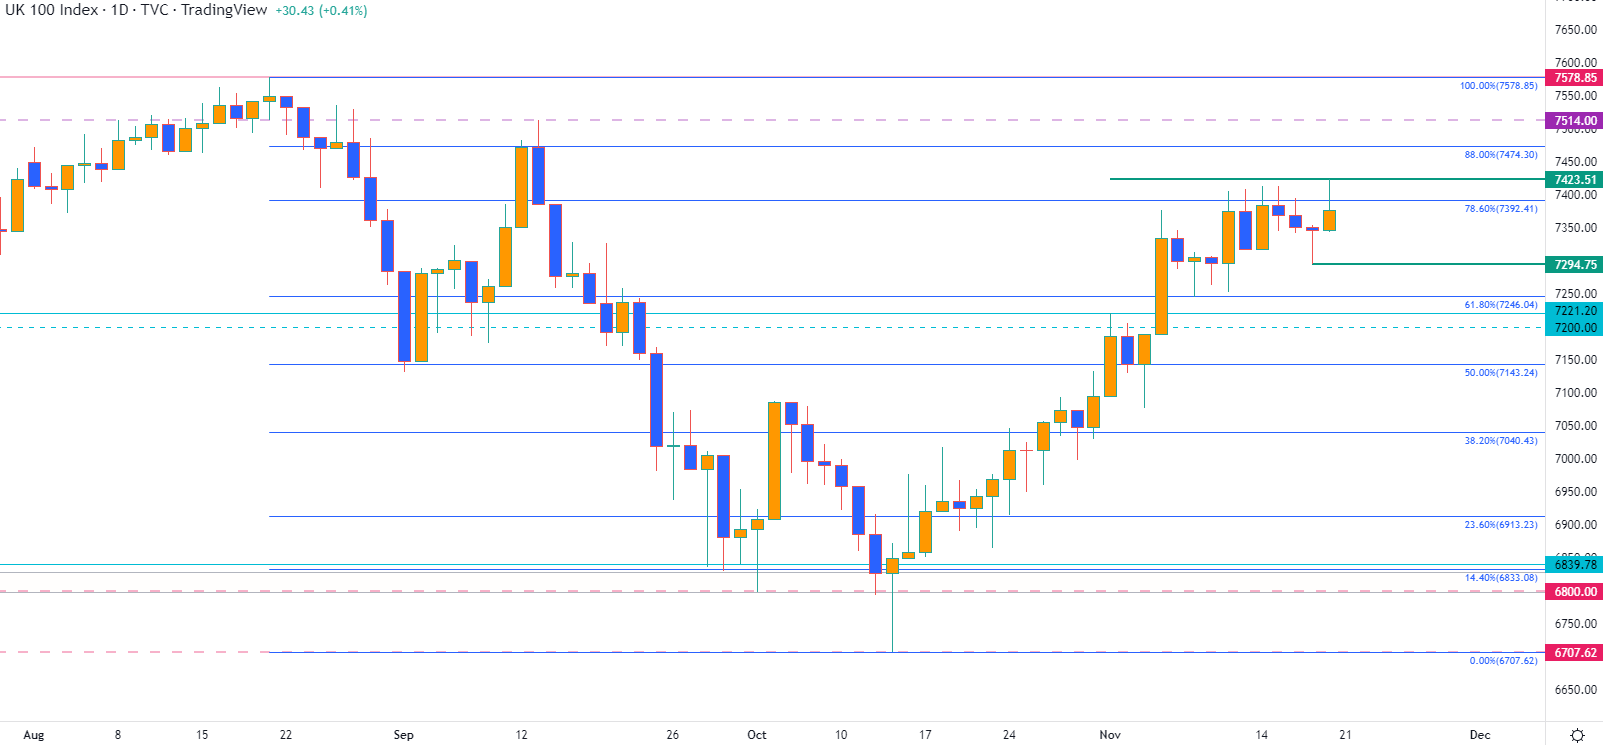
Chart prepared by Tammy Da Costa using TradingView

--- Written by Tammy Da Costa, Analyst for DailyFX.com
Contact and follow Tammy on Twitter: @Tams707


