


Fibonacci Analysis: Introduction
Although Fibonacci analysis stems from mathematics, it is also applicable to technical analysis, the premise of which implies that history repeats (to a degree) and that prices often move in trends. By combining Fibonacci analysis with multiple-time frame analysis, a trader may be able to adopt a better understanding of the overall trend as while identifying possibly key levels of support and resistance.
This article will discuss the application of Fibonacci Retracements using multiple time frames, focusing on how these levels may provide inflection points as support and/or resistance levels.
Fibonacci Application on Multiple Time Frames
Many traders often ask what time frame is most suitable when assessing current market trends, unaware of the benefits of multiple-time frame analysis, which allows a trader to analyze a single financial instrument using multiple vantage points. Long-term charts include much larger sample sizes which can reduce the amount of ‘noise’, often providing a more holistic view on the market. However, short-term charts provide a general overview of the current trend and short-term market dynamics, which is useful when seeking potential entry and exit points. It is often found that Fibonacci retracement levels from both the long and shorter time frames, will result in key levels of support and resistance, an example of which can be seen below.
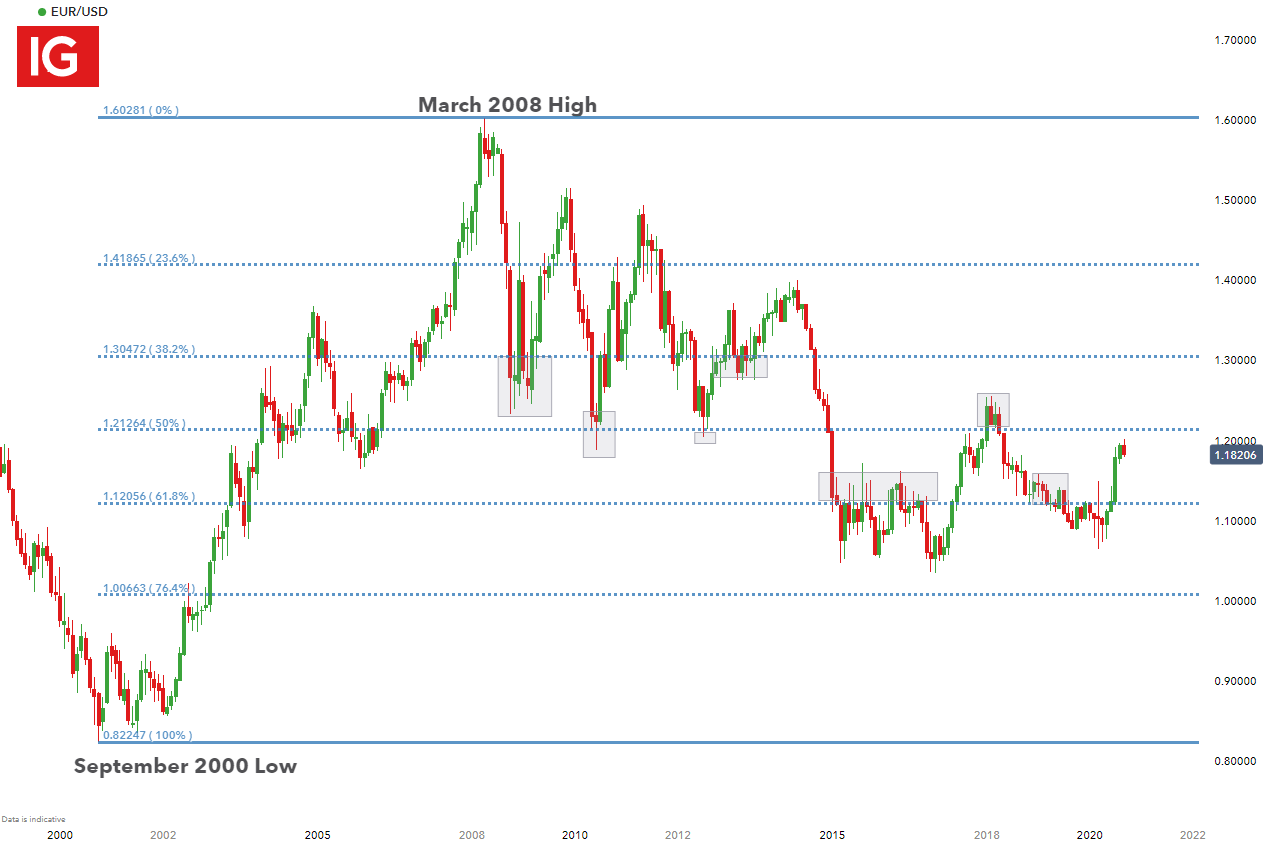
The EUR/USD monthly chart below highlights the Fibonacci retracement (blue) from the September 2000 low to the March 2008 high. This move represents the historical high and low which have yet to be violated.
As demonstrated below, from a long-term perspective, the Fibonacci retracement has provided strong areas of support and resistance, with price action often shorter-term inflections off of these longer-term support/resistance levels.
Fibonacci Retracement Levels to Locate Inflections
After the historical move has been identified, the weekly chart can then be used to locate other key major moves and potential inflection points.
Following on from the EUR/USD example, the weekly chart below now includes Fibonacci levels from two additional major moves. The first Fibonacci retracement (pink) is taken from the January 2017 low to the February 2018 high (the medium-term move), while the second Fibonacci retracement (orange), represents the shorter-term move between the February 2018 high and the March 2020 low.
EUR/USD Weekly Chart
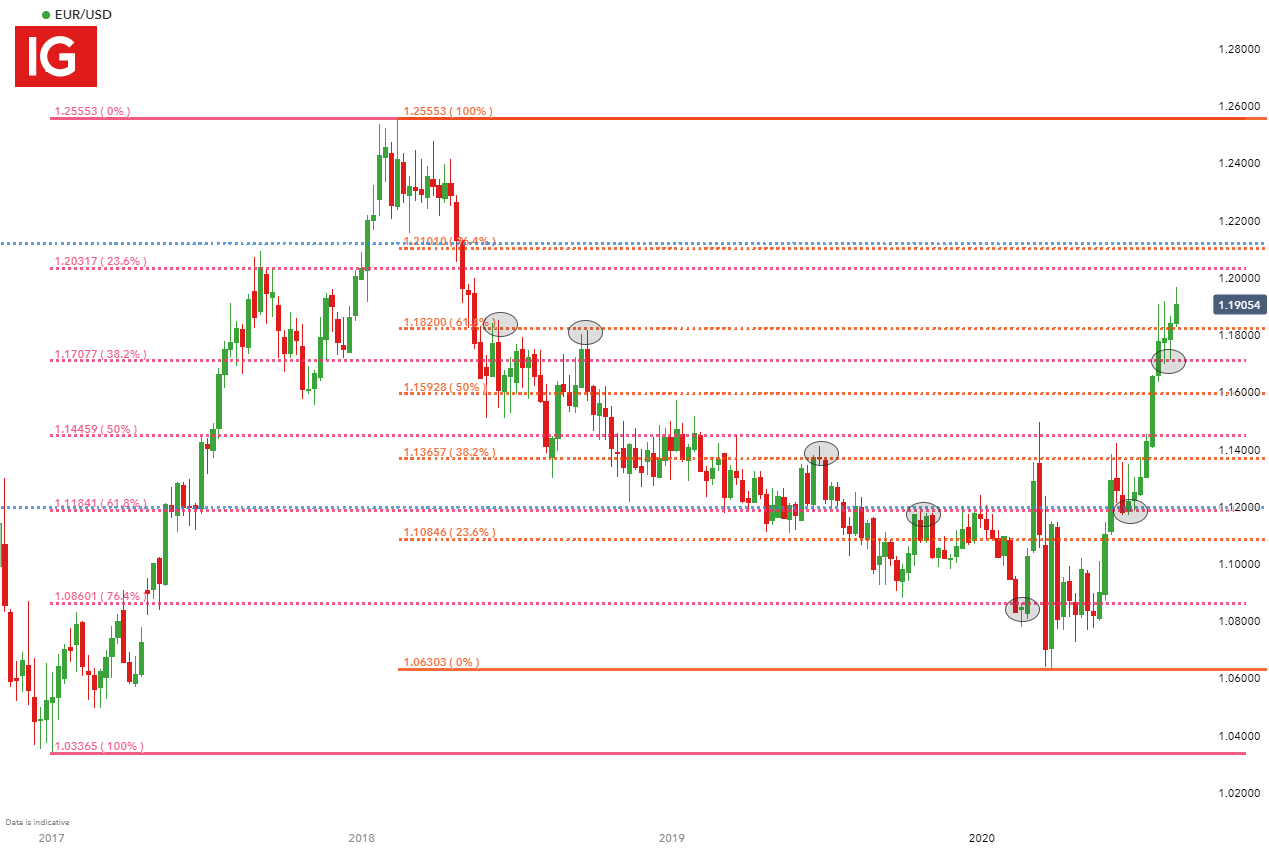
As demonstrated above, there are multiple instances where these levels have provided clear areas of support and resistance, highlighting the formation of inflection points on numerous occasions, often driving a penchant for mean reversal. Although all retracement levels provide information, the golden ratio 0f 61.8% and it’s reciprocal, 38.2%, are strong levels to bear in mind when using Fibonacci retracements for the purposes of trend continuation, often providing potential signs of a pullback in trend or a start of a new trend altogether once these levels are broken.
Putting it All Together with Fibonacci Application on Multiple Time Frames
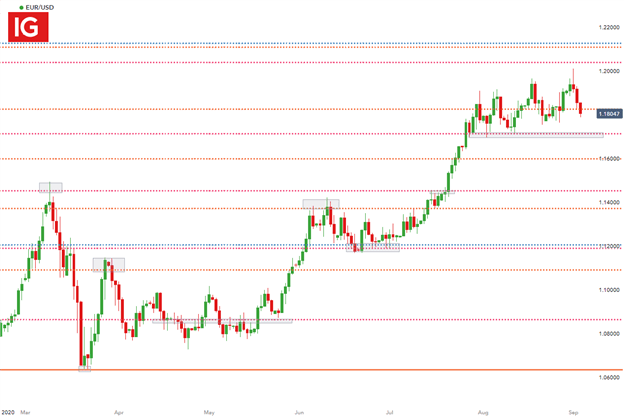
Now that we have identified the strong levels of support and resistance from the long-term charts, the daily chart can be used to represent the way in which these levels have impacted short-term price action. From a visual perspective, the EUR/USD daily charts demonstrates how these levels have impacted moves in the short-term, with price action exhibiting a number of inflections at these levels.

EUR/USD Daily Chart
H2: Confluence with Fibonacci and Support and Resistance
Although the Fibonacci retracement has been used in isolation throughout this article, the accuracy of analysis may be even more powerful when meshed together with another mechanism of support/resistance identification such as psychological levels and/or prior price action swings.
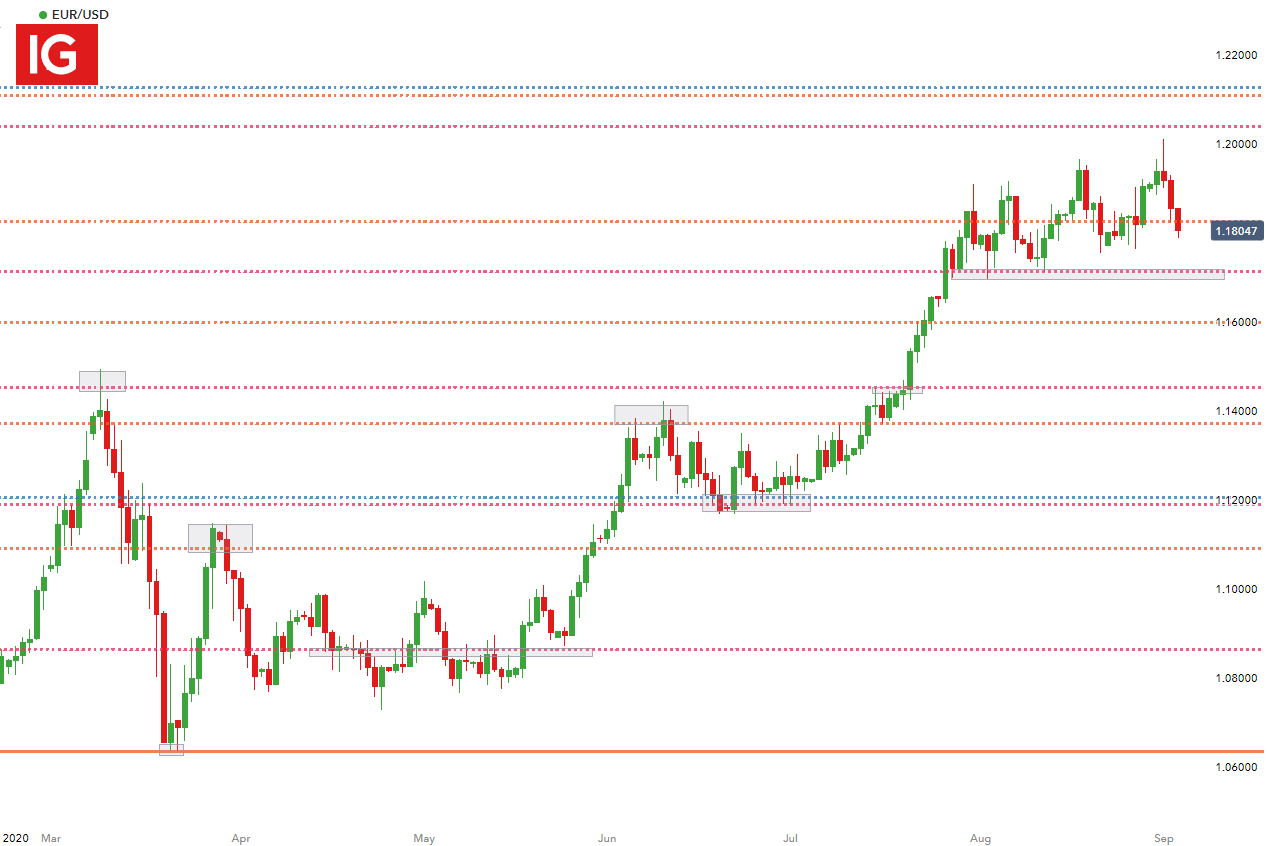
The EUR/USD daily chart below, now highlights how Fibonacci is not the only mechanism of support/resistance. A closer look at the chart shows how the 50% retracement of the medium-term move helped catch the top of the March 2020 high and stalled the move in July before the bullish breakout which persisted until price action came into a wall of resistance at the psychological level of 1.1800 which then became a key level of support.

EUR/USD Daily Chart
Summary
- Fibonacci retracements levels may provide key support and resistance levels
- Multiple time analysis may improve efficiency of analysis
- Fibonacci retracements may be more powerful when used in conjunction with other technical tools