US DOLLAR OUTLOOK:
- U.S. dollar lacks directional conviction despite the rebound in U.S. Treasury yields and hot inflation data
- The Fed’s monetary policy announcement next week will be key in determining the greenback’s trading bias in the near term
- This article looks at EUR/USD and GBP/USD key tech levels to keep an eye on over the coming sessions

Most Read: S&P 500, Dow Jones and Nasdaq Rip Higher - Banks & Tech Stocks Surge
The U.S. dollar, as measured by the DXY index, was largely flat on Tuesday, oscillating between small gains and losses around the 103.65 level despite the moderate rebound in U.S. Treasury yields and uncomfortably high inflation data released this morning by the U.S. Bureau of Labor Statistics.
By way of context, February headline CPI clocked in at 0.5% m-o-m and 6.0% y-o-y, in line with estimates. However, the core gauge topped expectations, rising 0.5% m-o-m, the quickest pace in five months. With this result, the annual rate settled a little lower to 5.5% from 5.6%, a slow directional improvement.
Elevated inflationary pressures prompted traders to increase bets that the FOMC will raise rates by 25 basis points to 4.75-5.00% at its March meeting, with the probability of that outcome climbing to 74% versus 65% yesterday when expectations shifted in a more dovish direction following the U.S. banking sector turmoil.
While much higher rates are likely needed to restore price stability, it would not be surprising if the Fed adopted a more cautious approach at its next meeting, even if that contradicts Powell's hawkish message delivered at his semi-annual appearance before Congress last week. This is because the landscape has changed dramatically in last few days.

Recent bank runs that led to the downfall of SVB and SBNY have exposed cracks in the banking ecosystem caused in part by overly restrictive monetary policy. The situation threatened to propagate rapidly that the Fed had to intervene to protect depositors, launching an emergency liquidity program to shore up struggling lenders.
All in all, systemic risks could throw a wrench in policymakers’ hiking plans, at least temporarily, pushing them to prioritize financial stability over their fight against inflation, which is a much slower-moving problem. The stars appear to be aligning for the FOMC guidance to lean on the dovish side next week.
Prior to events in the last few days, the U.S. dollar had strong bullish momentum, but the tide has turned with bears now in control, that’s the nature of the market. Barring strong episodes of risk aversion/flight to safety, the greenback could continue to retreat in the near term, especially if dovish expectations for the Fed come to fruition.
| Change in | Longs | Shorts | OI |
| Daily | -1% | -4% | -3% |
| Weekly | 4% | -10% | -5% |
EUR/USD TECHNICAL ANALYSIS
Last week, EUR/USD plunged towards a key support near 1.0535, but bulls defended this floor, paving the way for a strong rally off of those levels, with the exchange rate now above the 50-day moving average. If gains continue in the days ahead, resistance is seen at 1.0790, followed by 1.0935. On the flip side, if sellers return and spark a bearish reversal, support rests at 1.0700, and 1.0620 thereafter.
EUR/USD TECHNICAL CHART
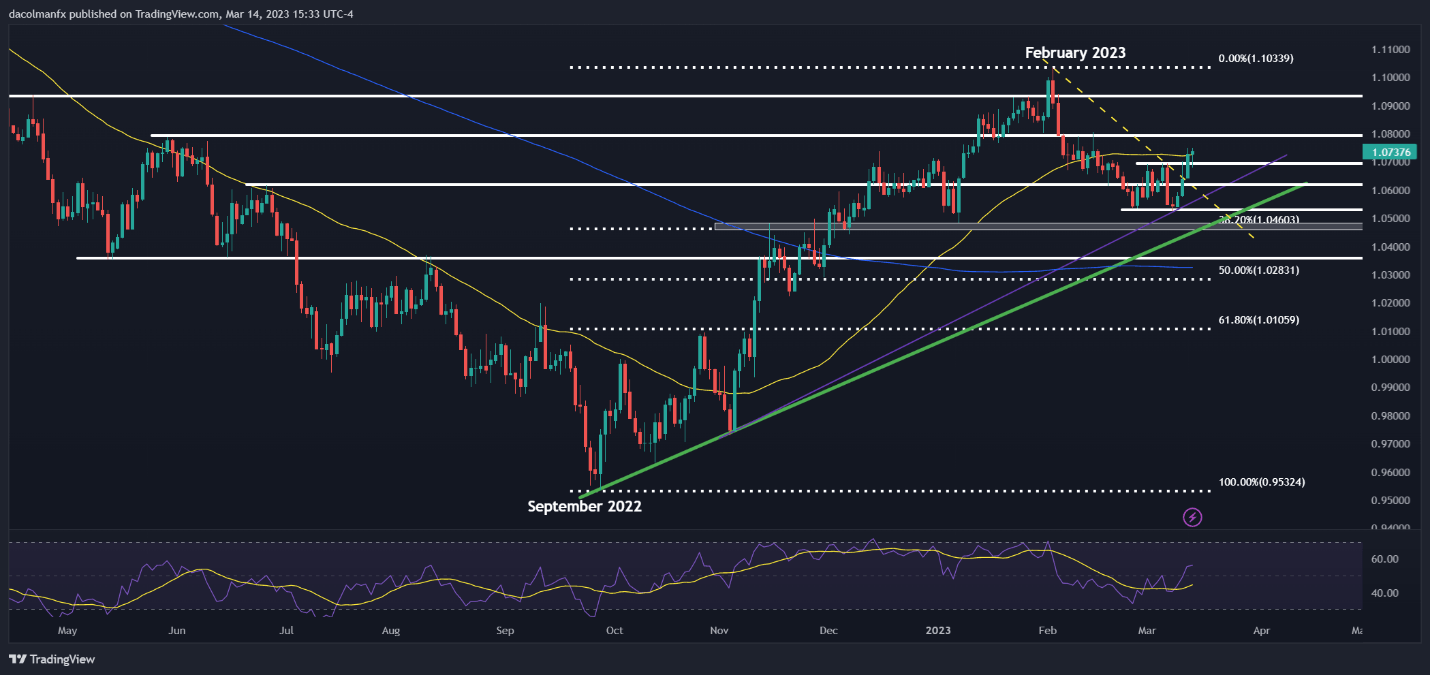
EUR/USD Chart Prepared Using TradingView
| Change in | Longs | Shorts | OI |
| Daily | 3% | -7% | -3% |
| Weekly | 4% | -10% | -5% |
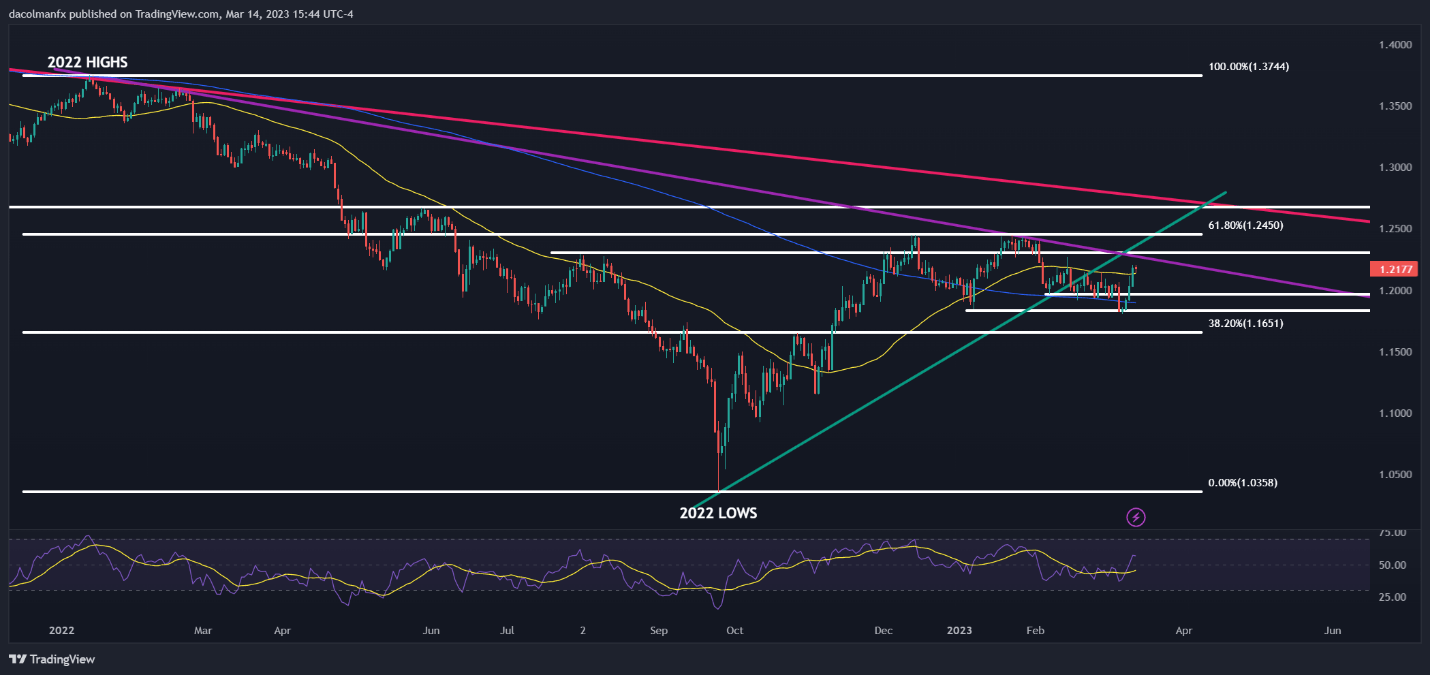
GBP/USD TECHNICAL ANALYSIS
After its recent rebound, GBP/USD is quickly approaching cluster resistance in the 1.2275/1.2300 area, where last year's August highs align with a medium-term descending trendline in play for more than 14 months. If bulls manage to push prices above this ceiling decisively, we could see a move towards 1.2450, the 61.8% Fib retracement of the 2022 sell-off. Conversely, if bearish pressure reemerges and cable pivots lower, support comes in at 1.1970, followed by 1.1825.
GBP/USD TECHNICAL CHART