


S&P 500, Nasdaq 100 and DJI (Dow Jones) Outlook:
- S&P 500 benefits from a rebound in beaten down bank stocks.
- Dow Jones bounces off Fibonacci support before stabilizing around 32,400.
- Nasdaq 100 surges over 2.3% as prices rise above 12,300.

US equity indices surge after CPI data supports lower rates
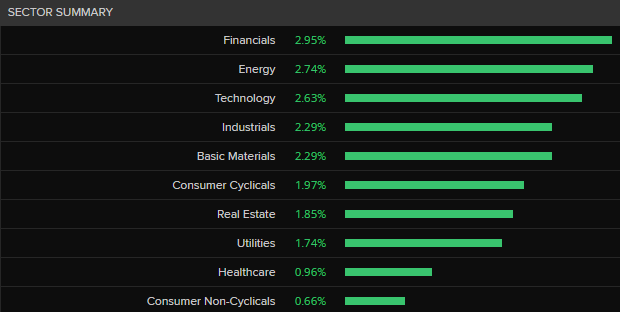
US stock futures have ripped higher, with S&P 500, Nasdaq and Dow Jones recovering from the recent sell-off. With interest rate expectations and a rebound in bank stocks supporting the rally, financials, industrials and technology led gains, driving major stock indices higher.
After the collapse of SVB (Silicon Valley Bank), US authorities assured clients that deposits would be guaranteed. As the injection of liquidity into financial markets filtered through, the probability of a 50-basis point rate hike at next week’s FOMC subsided.
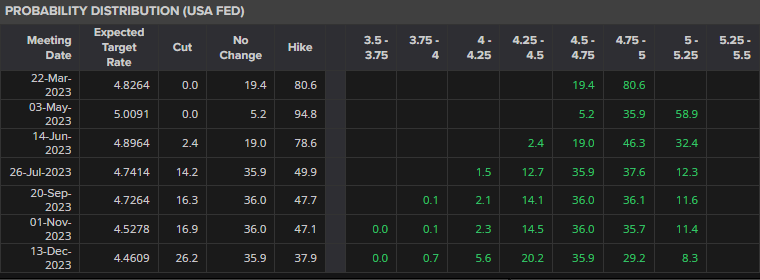
Source: Refinitiv

Although the Federal Reserve has remained committed to taming inflation, the release of US CPI data provided an additional catalyst for price action.
With both Core inflation and the annual inflation rate in-line with estimates, the repricing of rate expectations (participants now favoring a 25-basis point rate hike) has boosted demand for risk assets.
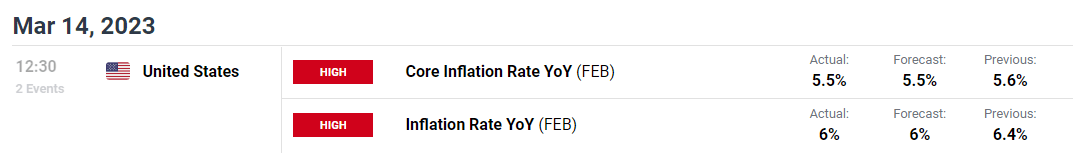
DailyFX Economic Calendar
S&P 500 Price Action
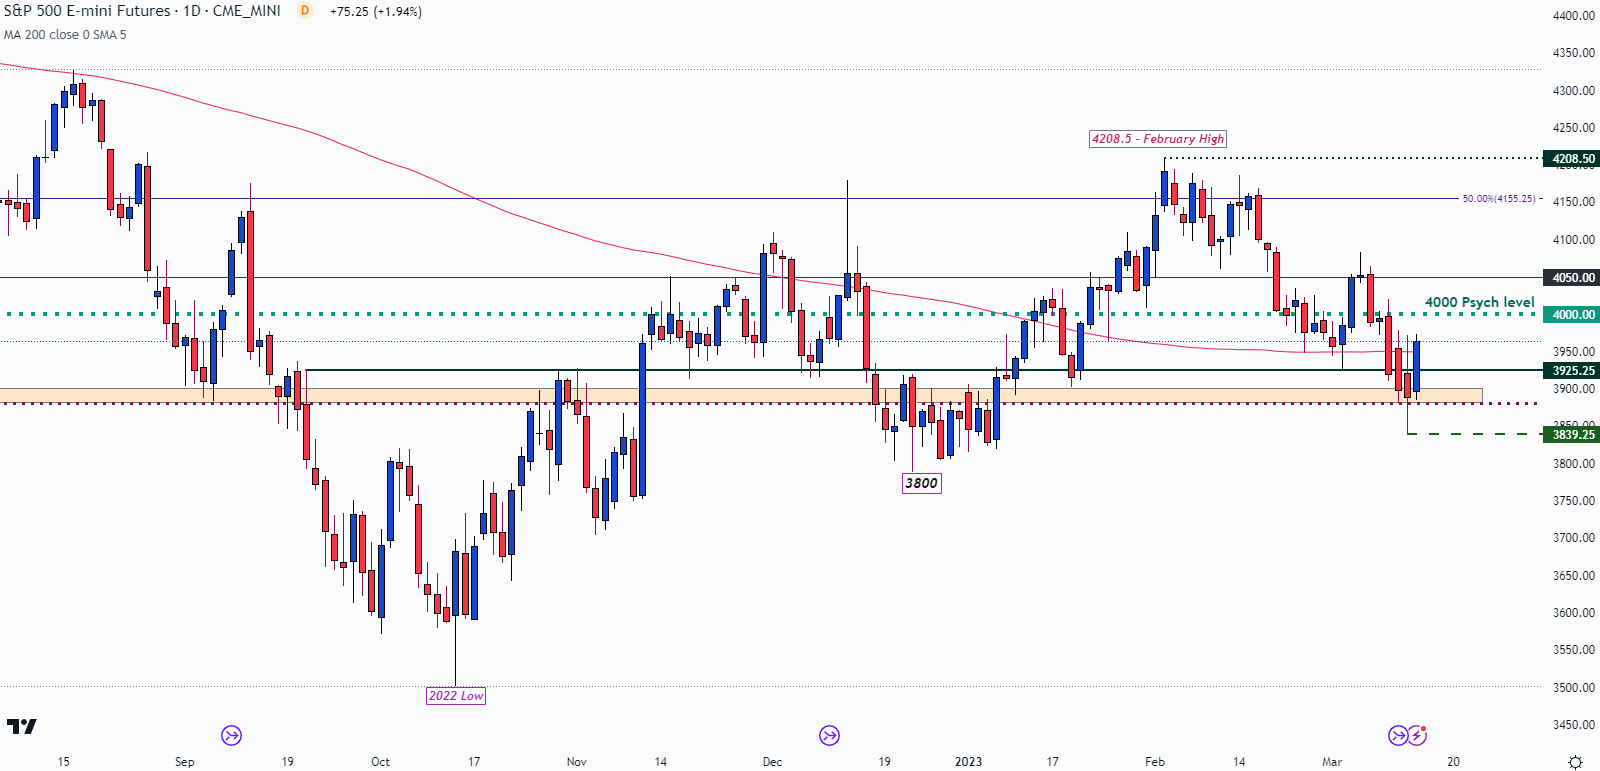
At the time of writing, S&P 500 futures are trading close to 2% higher on the day. As First Republic Bank leads gains with a 49% rise, the index is testing the 200-day MA (moving average), providing resistance around 3,950.
With the 4,000 psychological level up ahead, support has formed around 3,925. While financials continue to drive prices higher, bulls will need to clear 4,000 to recover from last week’s losses.
S&P 500 Daily Chart
Nasdaq 100 Price Action
For the Nasdaq 100, industrials and tech stocks have been lifted by earnings and a shift in sentiment. With the index currently trading 2.34% higher in the current session, a hold above 12,300 could bring the March high back into play around 12,486.
Nasdaq Daily Chart
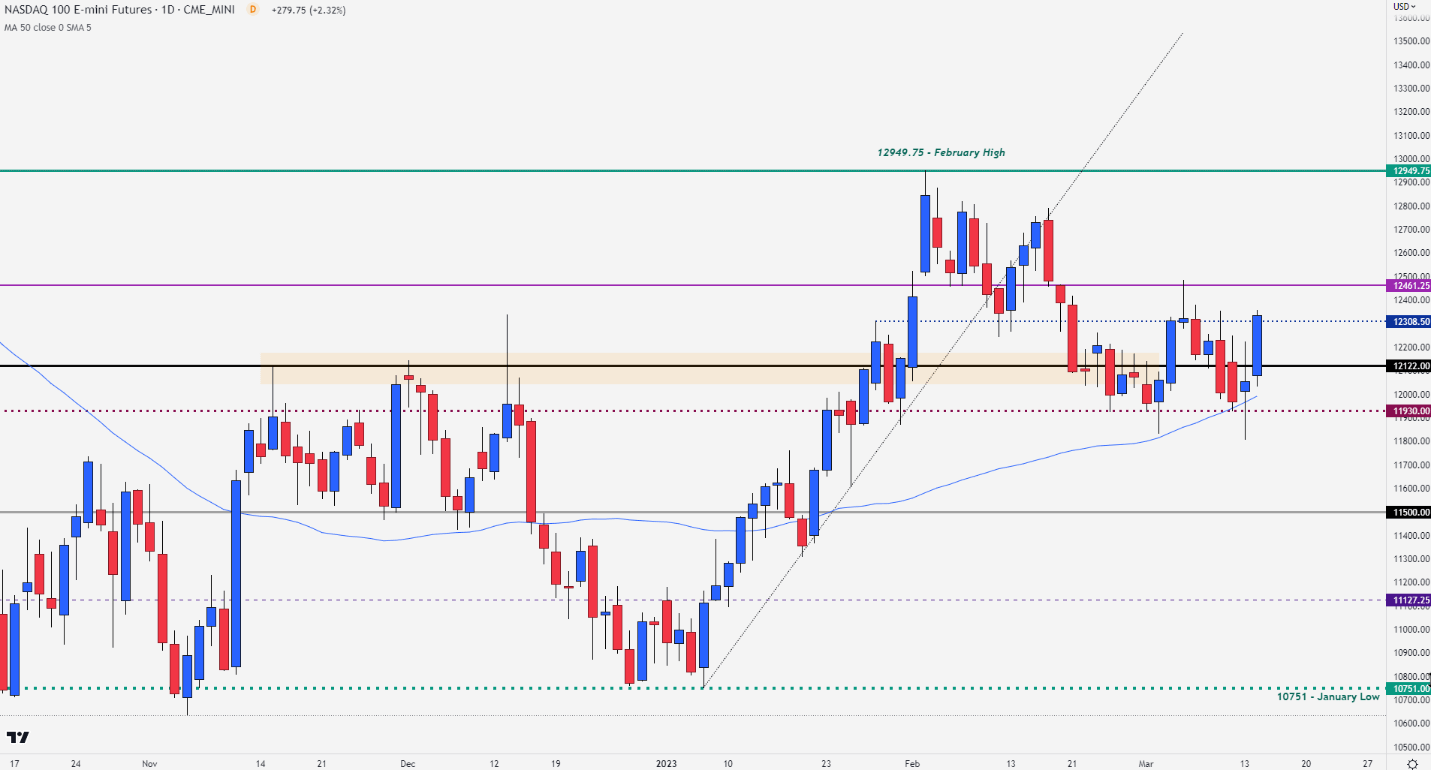
Chart prepared by Tammy Da Costa using TradingView
However, if bullish momentum fades, a move back to 12,000 would be necessary to fuel bearish momentum.
Dow Jones (DJI) Price Action
After bouncing off the 38.2% Fibonacci retracement of the 2022 move (31,766), Dow Jones futures continued higher before running into another barrier of resistance at 32,400. With the Salesforce Inc currently leading gains, a move higher could see the next big level of resistance forming at 33,000.
| Change in | Longs | Shorts | OI |
| Daily | -18% | 18% | 7% |
| Weekly | -19% | 14% | 4% |
Dow Jones Price Index Daily Chart
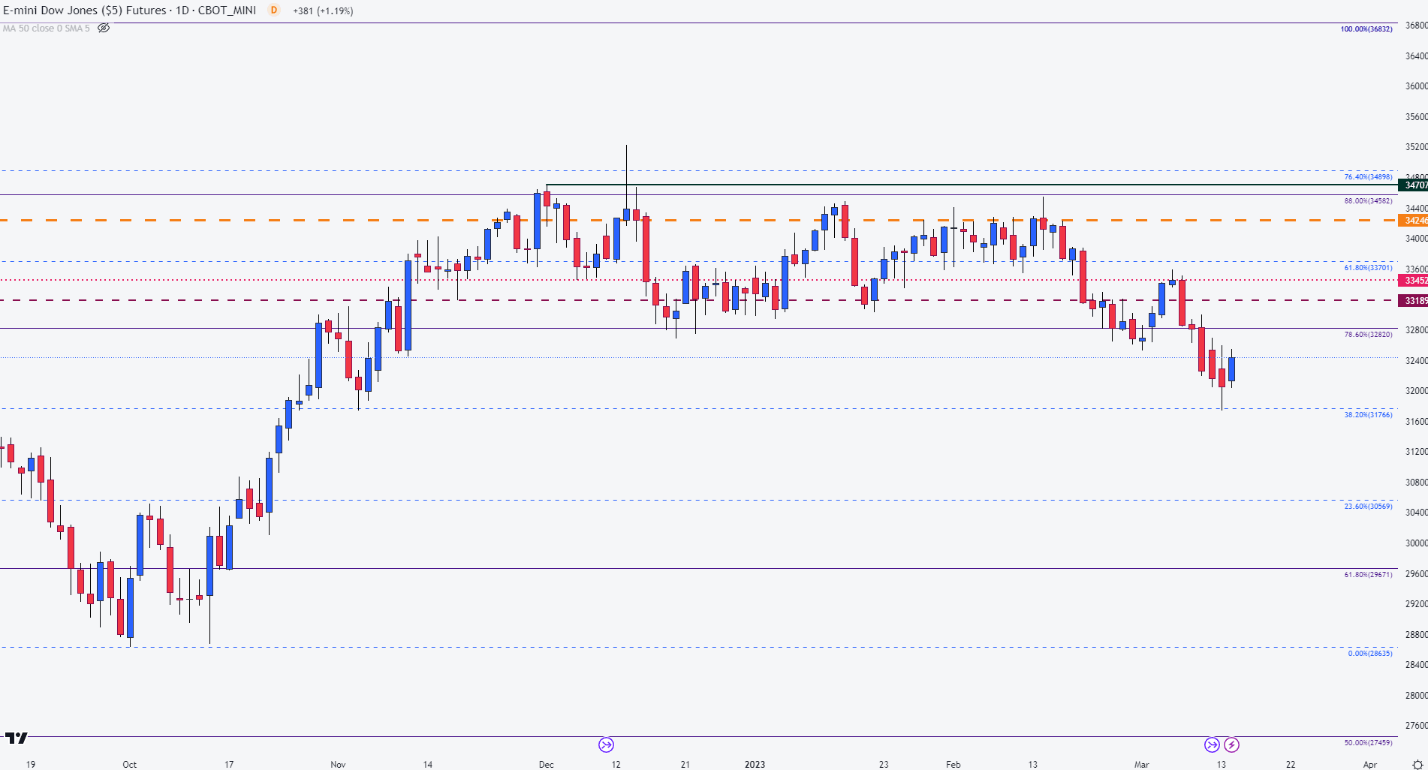
Chart prepared by Tammy Da Costa using TradingView
--- Written by Tammy Da Costa, Analyst for DailyFX.com
Contact and follow Tammy on Twitter: @Tams707


