US DOLLAR OUTLOOK:
- The U.S. dollar began the week on the back foot, dropping precipitously after a deep decline in U.S. Treasury yields
- Yields have moved lower on expectations that the Fed could adopt a more dovish stance in light of recent stress in the banking sector following SVB’s collapse
- The February U.S. inflation report will take the spotlight on Tuesday, but incoming data may become less relevant so long as the risks of a “credit event” remain present

Most Read: Fed Steps In to Avoid Systemic Risks After SVB Fallout. Is the S&P 500 Safe?
The U.S. dollar, as measured by the DXY index, plunged on Monday, falling nearly 1% and reaching its lowest level in nearly a month, dragged lower by the downward shift in the U.S. Treasury curve in the wake of the Silicon Valley Bank’s collapse.
U.S. bond yields have plummeted since last Thursday amid a dovish reassessment of the Fed’s policy outlook following SVB’s demise, the second largest bank failure in U.S. history. The chart below shows how markets have responded to the ongoing chaos in the U.S. banking sector.
FED FUNDS FUTURES, TREASURY YIELDS AND US DOLLAR CHART
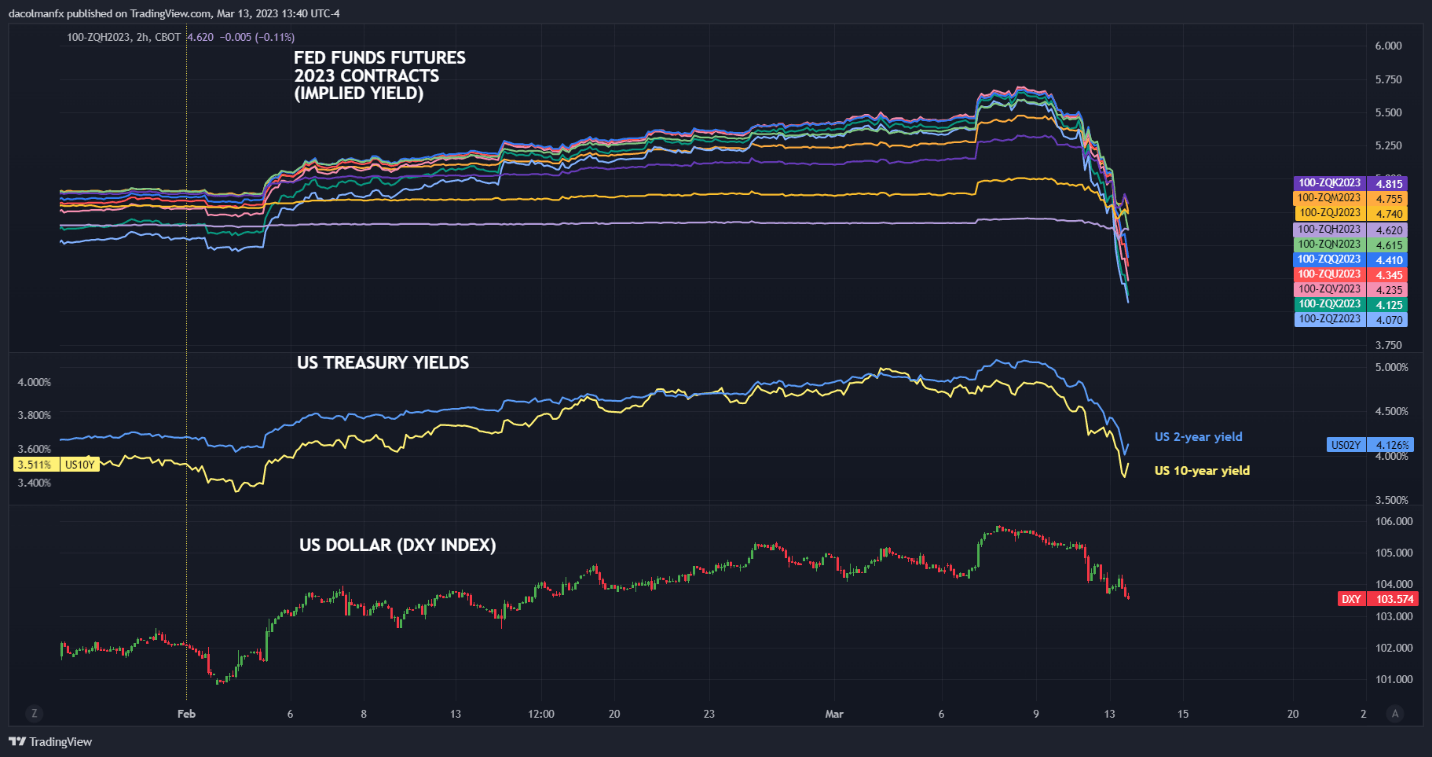
Source: TradingView
Financial upheaval has caused traders to reprice lower the FOMC’s hiking path on the assumption that policymakers will ultimately abandon their inflation-fighting efforts, at least for now, to avoid a "credit event" that could be catastrophic for the U.S. economy. If proven correct, incoming data, such as the February CPI report due out Tuesday morning, could carry less weight in the FOMC’s reaction function.
Fed Chair Powell embraced an ultra-hawkish position at his Congressional hearing last week, pledging to stay the course, but financial instability is changing the calculus quickly. In fact, recent developments suggest minds are already being swayed, with the central bank launching a lending facility to backstop depository institutions on Sunday, an emergency action that smacks of panic.
In any case, to limit contagion and prevent the current crisis from becoming systemic, the Federal Reserve may soon adopt a more cautious approach and put its aggressive tactics on hold. It is true that price pressures remain strong, but higher inflation for longer would be a less negative outcome than a collapse of the U.S. banking system triggered in part by overly restrictive monetary policy. Judging from recent events, it appears that the cost of additional rate hikes could outweigh its benefits.
With markets starting to discount a Fed dovish pivot, the U.S. dollar could extend losses in the near term unless haven demand picks up pace and boost defensive assets.
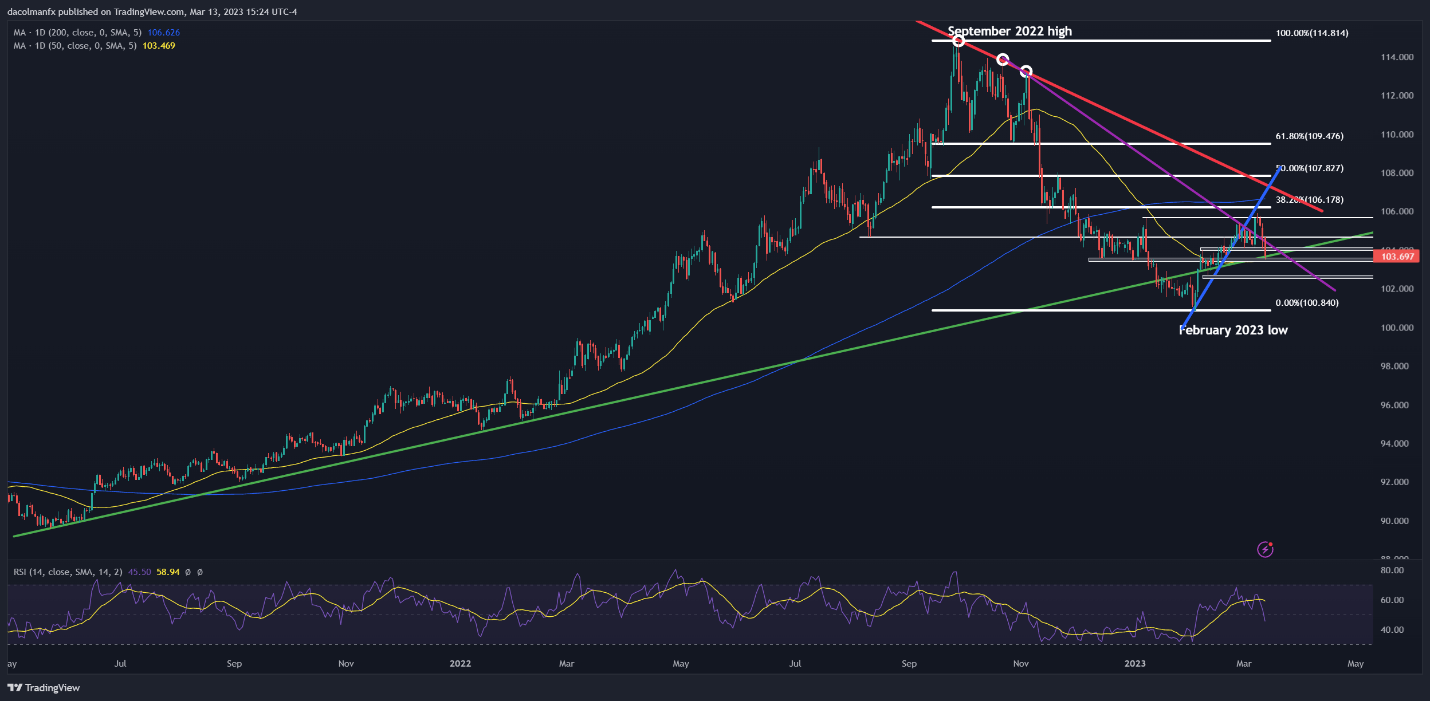
Focusing on technical analysis, the DXY index is currently probing support after the recent selloff, with prices sitting above a long-term rising trendline and the December lows around 103.50. If this area of support is breached, we could see a move towards 102.60, followed by a retest of this year’s trough.
On the flip side, if the index stages a bullish comeback, resistance appears near the psychological 104.00 level, and 104.65 thereafter.

US DOLLAR (DXY) TECHNICAL CHART