
GBP/USD AND USD/JPY TECHNICAL OUTLOOK
- GBP/USD rises, but bullish momentum appears to be waning as prices probe key cluster resistance region
- USD/JPY extends its advance after breaking above its 50-day moving average
- This article looks at key technical levels to watch in the coming days and weeks
Most Read: USD/CAD Rises on Oil’s Slump, Nasdaq 100 Carves Double Top Pattern as Bears Lurk
| Change in | Longs | Shorts | OI |
| Daily | -3% | -2% | -3% |
| Weekly | -17% | 25% | -3% |
GBP/USD TECHNICAL ANALYSIS
GBP/USD advanced on Wednesday, but gains were modest despite a rally in U.K. government bond yields, which rose sharply and more than their global counterparts after March inflation data surprised to the upside. While double-digit inflation may prompt the Bank of England to raise rates again in May, the British pound may not get much support from the monetary policy front if further tightening compromises the country's fundamentals and the stagnant economy, and lead to a recession down the road.
From a technical analysis standpoint, GBP/USD has been in an uptrend in recent months, but the pair has struggled to clear cluster resistance stretching from 1.2450 to 1.2550, where the 61.8% Fib retracement of the 2022 decline converges with a medium-term downtrend line. Over the past few weeks, this resistance zone has been in play on several occasions, but prices have turned lower after every test, a sign that bullish conviction may be wavering amid mixed market sentiment.
With cable probing the 1.2450/1.2550 area at the time of writing, it may be just a matter of time before the tug-of-war between bulls and bears is resolved. Traders will have more clues on the outlook soon, but there are two possible scenarios worth considering and preparing for: a topside breakout and a bearish rejection, with the former setting the stage for a possible rally toward long-term trendline resistance at 1.2675 and the latter exposing last week's low at 1.2345 and 1.2275 thereafter.
GBP/USD TECHNICAL CHART

GBP/USD Technical Chart Prepared Using TradingView
| Change in | Longs | Shorts | OI |
| Daily | -17% | -2% | -4% |
| Weekly | -6% | 4% | 2% |
USD/JPY TECHNICAL ANALYSIS
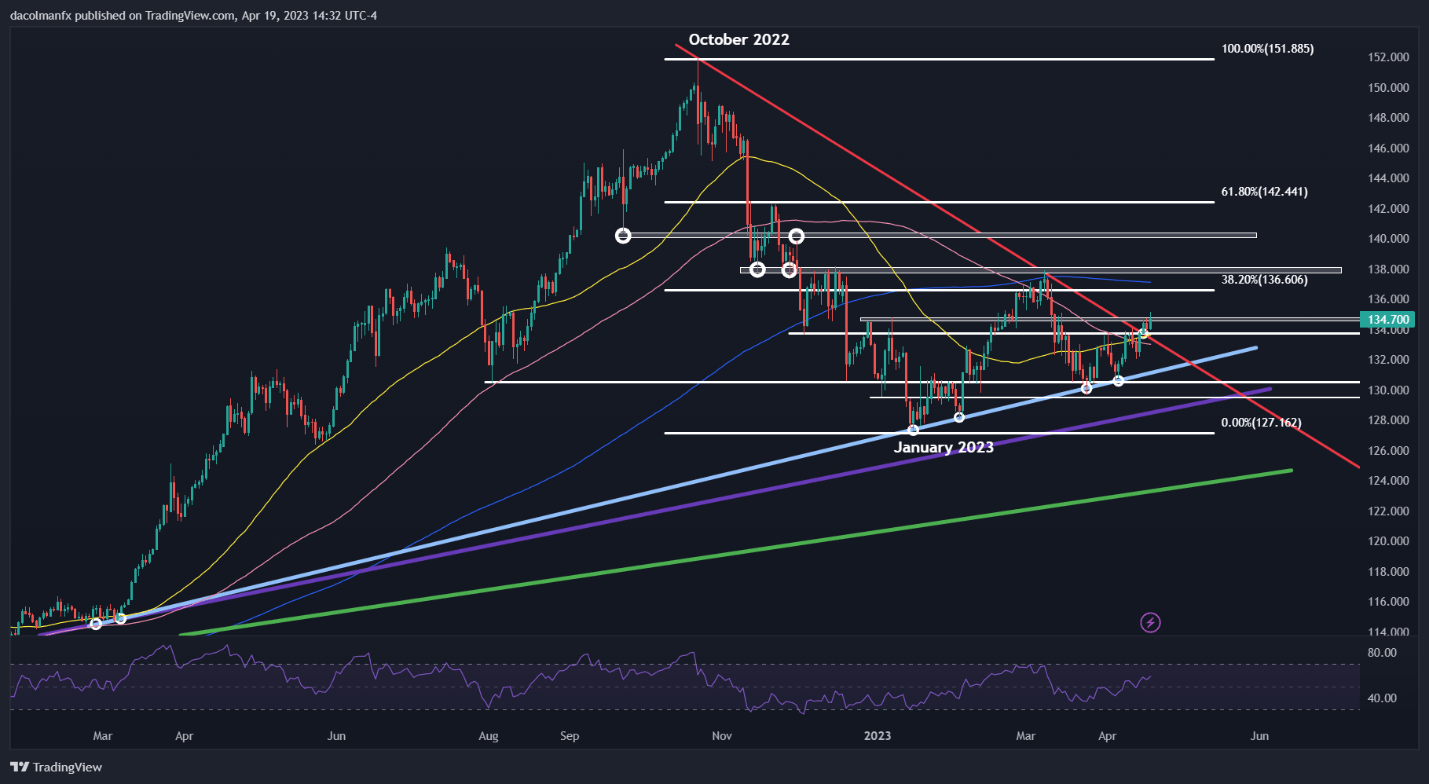
USD/JPY has rallied sharply since late March as U.S. Treasury yields have resumed their ascent, breaching key technical levels on its way higher. In recent days, the pair has overtaken its 50-day simple moving average and pierced trendline resistance at 133.80, reinforcing its positive impetus.
With momentum on its side, USD/JPY could have room to extend its advance over the coming days, but prices must first clear a key barrier at 134.75 in order for the market to have more conviction in the bullish thesis. If this scenario plays out, we could see a move towards 136.60, the 38.2% Fibonacci retracement of the October 2022/January 2023 correction.
Conversely, if USD/JPY fails to break above 134.75 and begins to retrench, dynamic support rests at 133.75. If this level is taken out, bears could become emboldened to launch an assault on 131.50, a major floor created by a rising trendline in play since February 2022.
USD/JPY TECHNICAL CHART