


Gold Price (XAU/USD), Chart, and Analysis
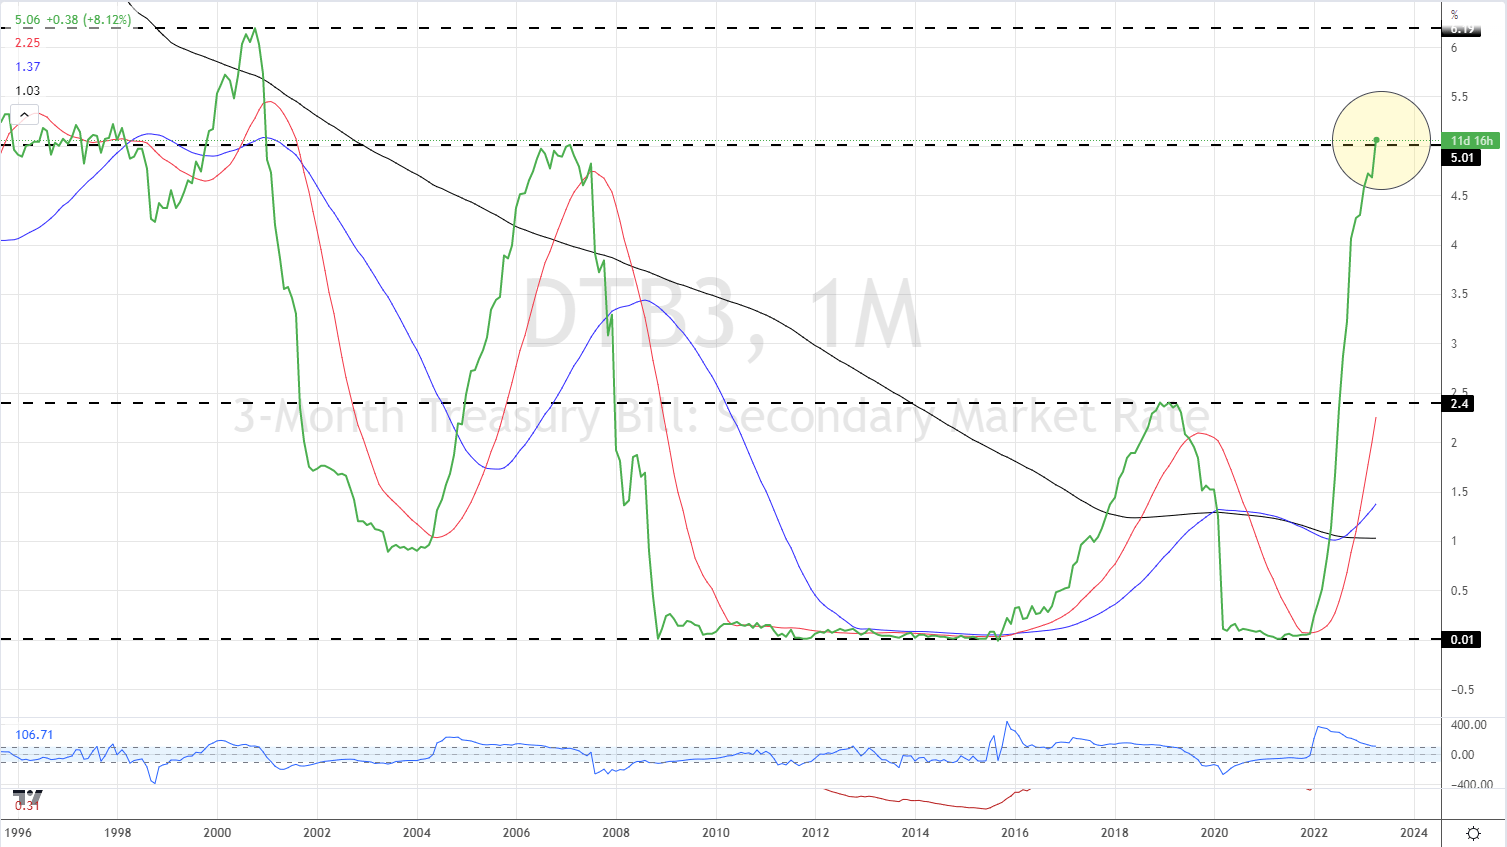
- US 3-month Treasury Bills yield in excess of 5%.
- Gold is likely to test support. Will it hold?

From building for a test of a new all-time high to testing prior levels of resistance in a matter of a few days, gold traders need to re-assess the reasons behind the precious metals' move. The re-pricing of US rate expectations continues with short-dated yields continuing to push higher. The yield on the 3-month UST Bill is now above 5%, back at the highest level seen since January 2001, and up nearly 500 basis points from January 2022. This short-term rate re-pricing is weighing on gold.
US Treasury 3-Month Bill Yields Monthly Price Chart - April 19, 2023
For all market-moving data releases and events, see the DailyFX Economic Calendar
Trade Smarter - Sign up for the DailyFX Newsletter
Receive timely and compelling market commentary from the DailyFX team
Gold is now looking at an important support level near $1,961/oz, a prior level of resistance that turned into support. If this level is broken then the 23.6% Fibonacci retracement level at $1,947/oz. comes into play. It is likely that this level will hold once the current bout of rising UST yields abates. Resistance is seen around $2,009/oz. before $2,048/oz.
Gold Price Daily Chart – April 19, 2023
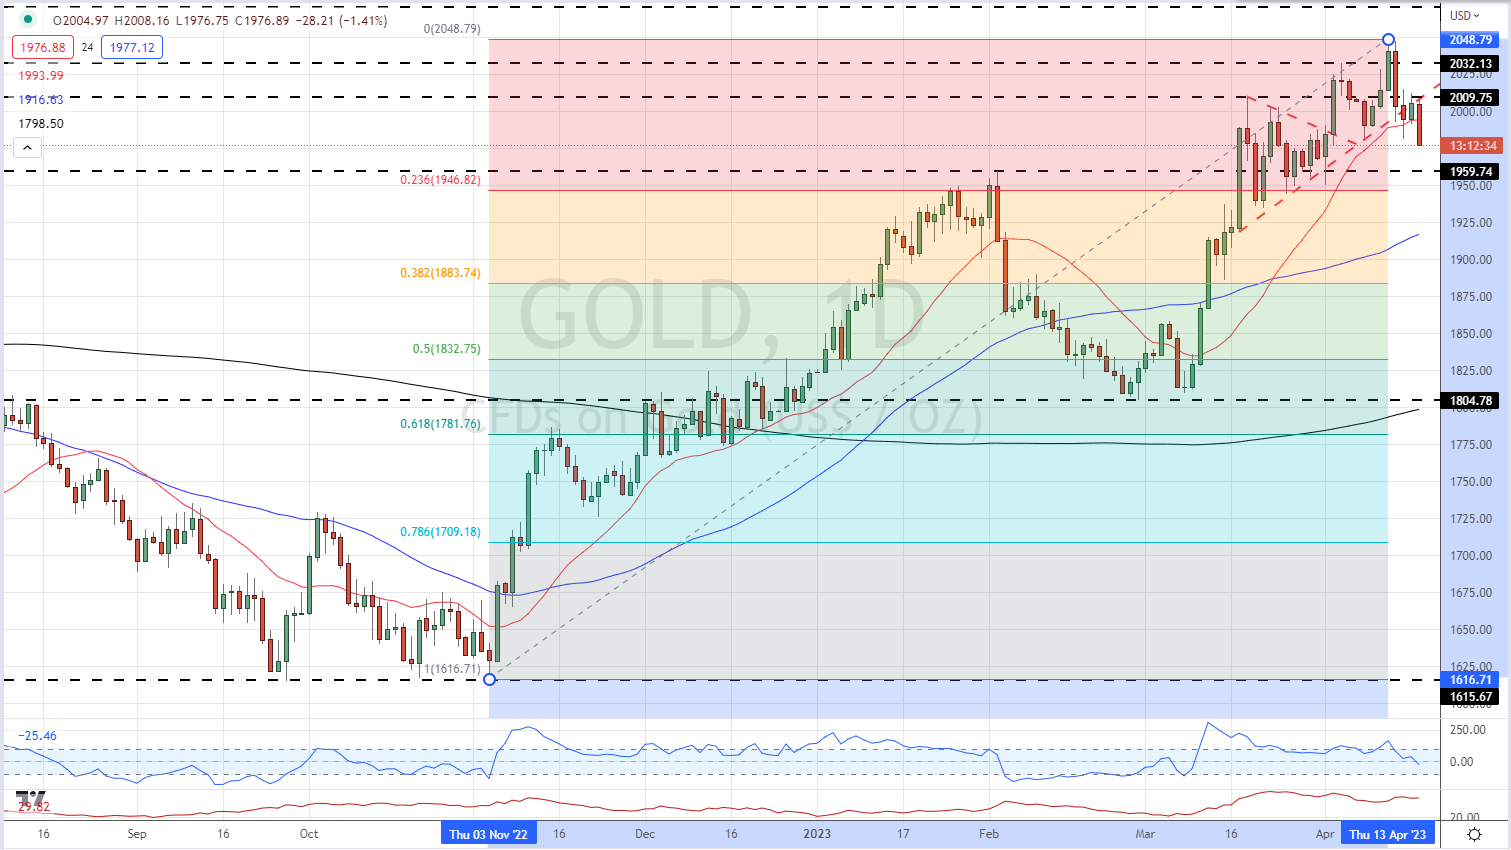
Chart via TradingView
| Change in | Longs | Shorts | OI |
| Daily | -10% | 27% | 0% |
| Weekly | -6% | 21% | 2% |
Retail Traders Increase Net-Shorts Further
Retail trader data show 57.52% of traders are net-long with the ratio of traders long to short at 1.35 to 1.The number of traders net-long is 5.28% lower than yesterday and 0.95% higher from last week, while the number of traders net-short is 7.52% higher than yesterday and 3.44% lower from last week.
We typically take a contrarian view to crowd sentiment, and the fact traders are net-long suggests Gold prices may continue to fall. Positioning is less net-long than yesterday but more net-long from last week. The combination of current sentiment and recent changes gives us a further mixed Gold trading bias.
What is your view on Gold – bullish or bearish?? You can let us know via the form at the end of this piece or you can contact the author via Twitter @nickcawley1.


