

Dollar Yen Technical Outlook: Neutral
- USD/JPY trades in a narrow range around the 130.00 psychological handle
- Dollar Yen builds in a zone of consolidation – is a breakout on the horizon?
- Price action stalls as bulls aim to retest 131.500

USD/JPY Trades in a Narrow Zone of Consolidation Around 130.000
USD/JPY has continued to move lower as lower rate probabilities for the upcoming FOMC economic data limits Dollar strength. Despite the robust economic data that has seen US GDP and Michigan sentiment beating expectations, price action has failed to gain traction above 131.000.
While the Dollar Yen cross benefited from a hawkish Federal Reserve and dovish BoJ (bank of Japan) last year, fundamental factors have already been priced in.
After reaching a high of 151.945 in October last year, the strong uptrend that drove prices to multi-decade highs eased, pushing prices lower. With the weaker dollar fueling the bearish move, USD/JPY continued to decline before finding temporary support at 127.223.
USD/JPY Weekly Chart
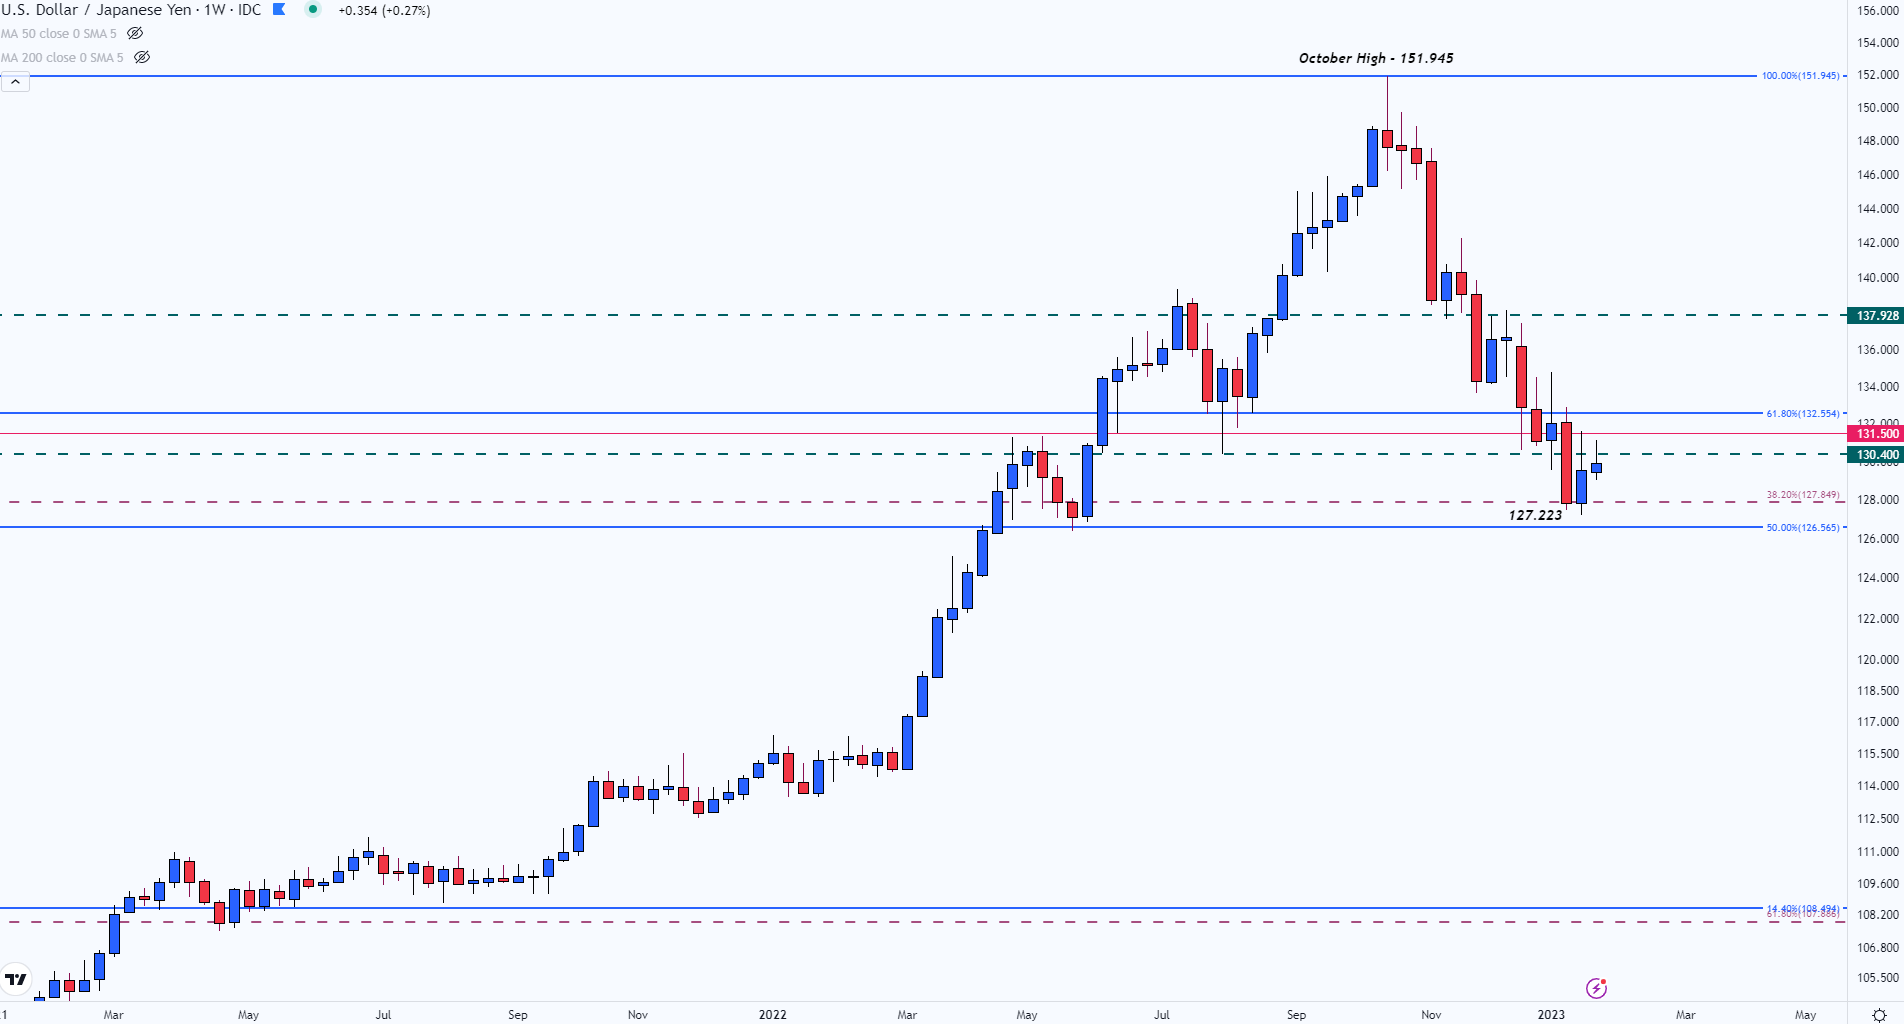
Chart prepared by Tammy Da Costa using TradingView
Although the shift in rhetoric has allowed the pair to return to levels last tested in May last year, bearish momentum has been eased, driving prices higher. While the 38.2% Fibonacci retracement of the 1990 – 2011 move provides support and resistance around 127.849, price action has fallen into a narrow range.

After the formation of a death cross (50 MA crosses below the 200 MA) on the daily time-frame, bulls continued to drive price action lower before rebounding off of trendline support at the current monthly low of 127.223.
USD/JPY Daily Chart
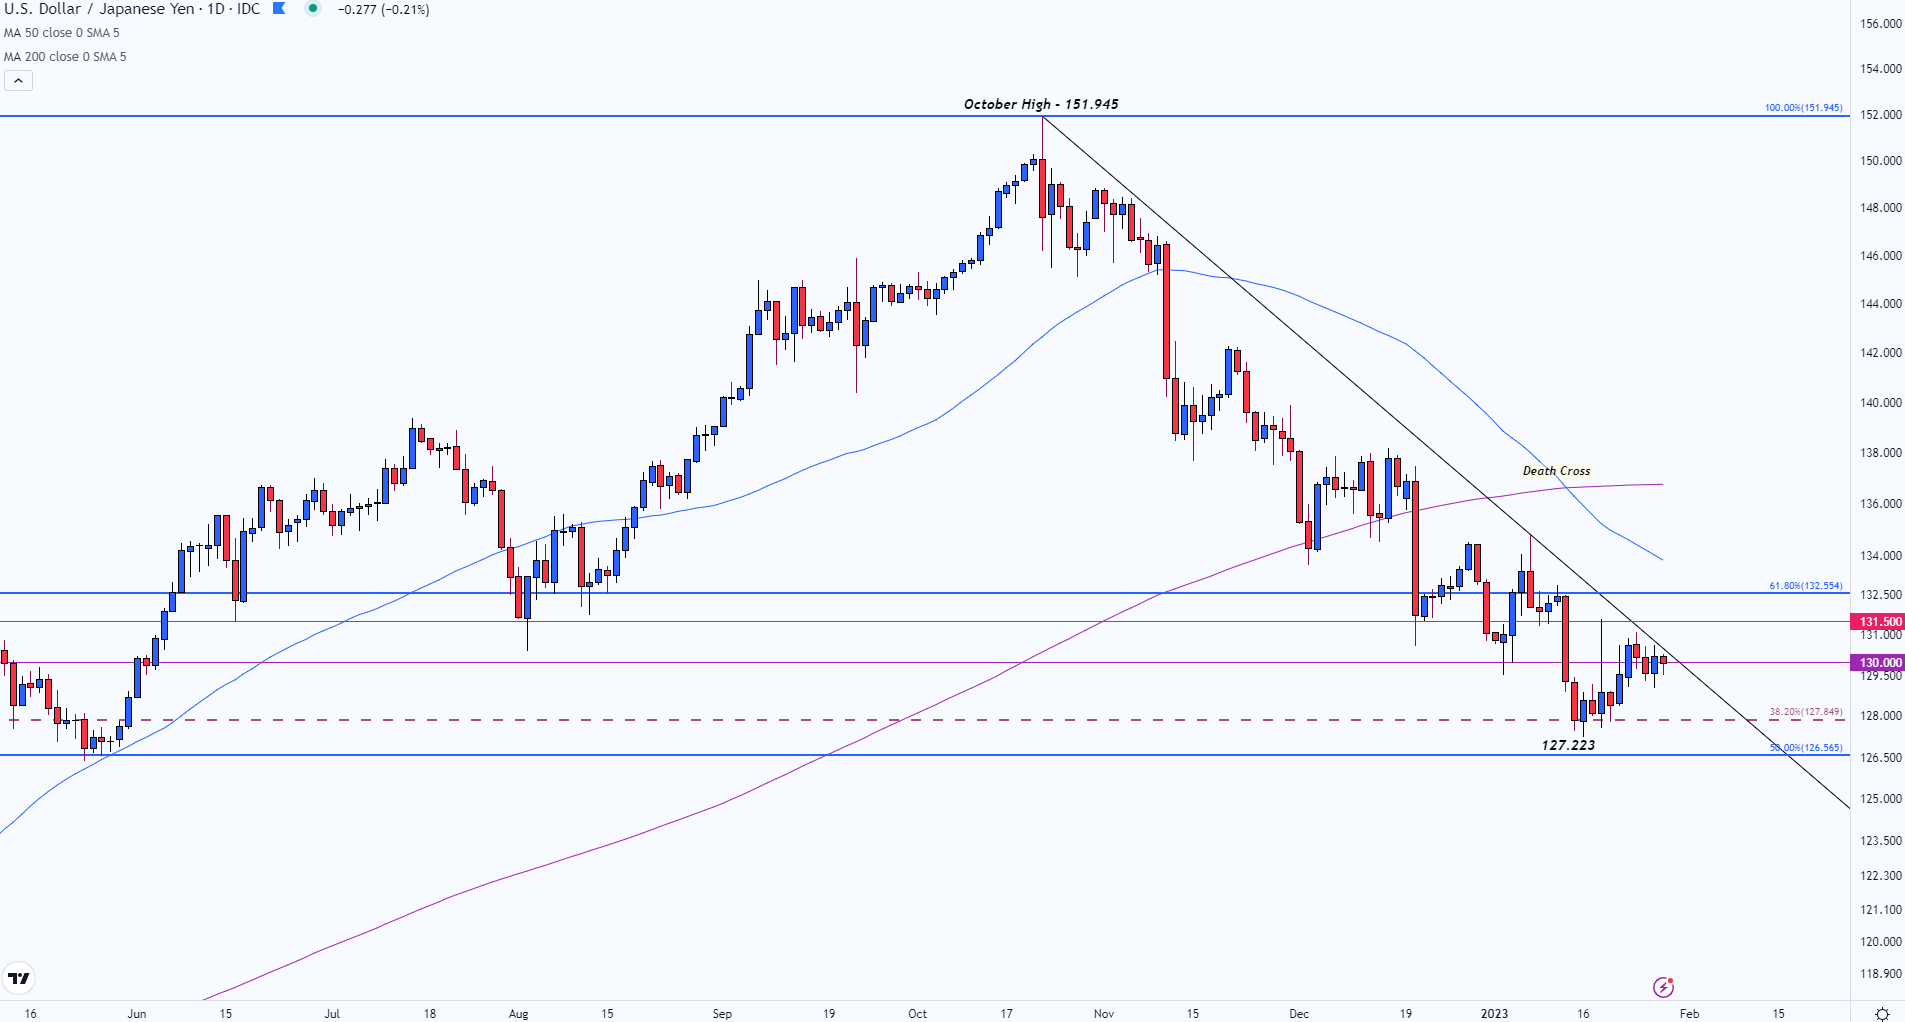
Chart prepared by Tammy Da Costa using TradingView
USD/JPY Technical Levels
As USD/JPY trades around the 130.00 psychological handle, a break of technical resistance could drive the major currency pair back towards 131.500. With this level holding as support in 2022 and in early Jan, the prior support level now holds as longer-term resistance.
While prices continue to consolidate, a break in either direction could drive momentum towards either direction. For the downside to persist, USD/JPY would need to fall below Fibonacci support and below the January low of 127.223. From there, the mid-point of the 2020 – 2022 move could come into play at 126.565 opening the door for bearish continuation towards 125.500.
--- Written by Tammy Da Costa, Analyst for DailyFX.com
Contact and follow Tammy on Twitter: @Tams707