


S&P 500, Dollar, EURUSD and Macro Economic Event Risk Talking Points:
- The Market Perspective: EURUSD Bearish Below 1.08; USDJPY Bullish Above 133; Dow Bearish Below 33,200
- The global capital markets were showing an unusual amount of volatility before an extended holiday weekend (in the US), but the technical picture was less than convincing
- Top event risk ahead includes: February PMIs; the RBNZ rate decision and the Fed’s favorite inflation indicator (PCE deflator)

‘Is this a break or not?’ I ask this question of markets often and there are two answers that you can generally come to regardless of what market you’re observing. On the one hand, there is the ‘technical’ break. That isn’t to say it is based in technical analysis, but rather that it fits what we would consider the textbook definition of a break. The contrast to that distinct picture is the ‘break of conviction’ where there seems to be a viable motivation behind the move that can be relied upon for follow through. It is worth evaluating the S&P 500 – as a benchmark for general ‘risk trends’ – through this past week. From a purely technical perspective, the index did clear support that was carrying the rising trend channel from the end of last year as well as the 20-day simple moving average (SMA) for the first time in 29 trading days.
That is a break, but the conviction for follow through meets some serious headwind as we look into the new trading week. Just from the chart itself, we have the recovery that occurred through the close that left a large ‘lower wick’. More problematic are the conditions that we will open the new week to: a market holiday that will take the US offline. My biggest concern is that there isn’t a clear fundamental charge upon which bears could find confidence in toppling the bulls. Interest rate expectations in the US have been on the rise for a few weeks while growth forecasts have been an issue for even longer, yet there was no relent until the end of this past week? It’s possible that new catalysts urge a significant shift in the undercurrent next week, but I don’t think we enter the week with a clear agenda.
Chart of S&P 500 with 20 and 100-day SMAs, Volume and ‘Wicks’ (Daily)
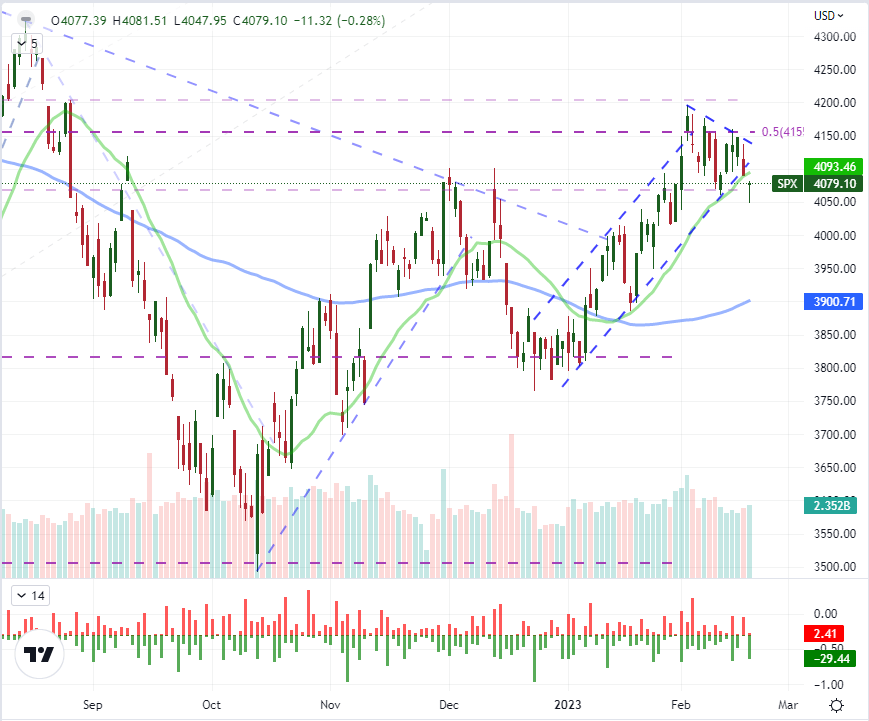
Chart Created on Tradingview Platform
Let’s take the same scrutiny to the Dollar. On the technical side, the DXY Dollar index managed to clear the upper bounds of a fairly consistent trend channel that formed in the wake of the October US CPI release (November 10th). And, in the case of the benchmark currency, there was a swell in interest rate expectations via Treasury Yields and Fed Funds futures that could insinuate a distinct fundamental backing to the move. For me, there is more evidence that a shift in trend has been made here than on the US indices; but there remain issues for me in the assessment of conviction. One concern is the inconsistency of the ‘break’ from the individual exchange rates. The DXY is an aggregate that draws significantly less trade than say EURUSD, USDJPY and GBPUSD. USDJPY earned a 133.00 bullish break last week, but EURUSD wouldn’t hold a clearance below 1.0650 and GBPUSD refused to hold below 1.2000.
Fundamentally, interest rate expectations seem stretched. More than just the market’s view trading at a premium now to the Fed’s, we are at a point where even higher terminal rates would meaningfully bolster the risk perceived for growth. That means, changes in rate forecasts are more likely to be skewed to the bearish side for the USD. Alternatively, the Dollar’s safe haven status is not currently contributing much lift to the currency as the VIX (one of the most popular measures of sentiment) is near its lowest levels in a year. That said, volatility reflects a greater risk of sudden movement should it swell versus a slow choppy retreat. In that case, the Dollar would benefit from sudden increases.
Chart of DXY Dollar Index Overlaid with Implied Fed Funds Aug 2023 Rate, 20 and 60-Day Correl (Daily)
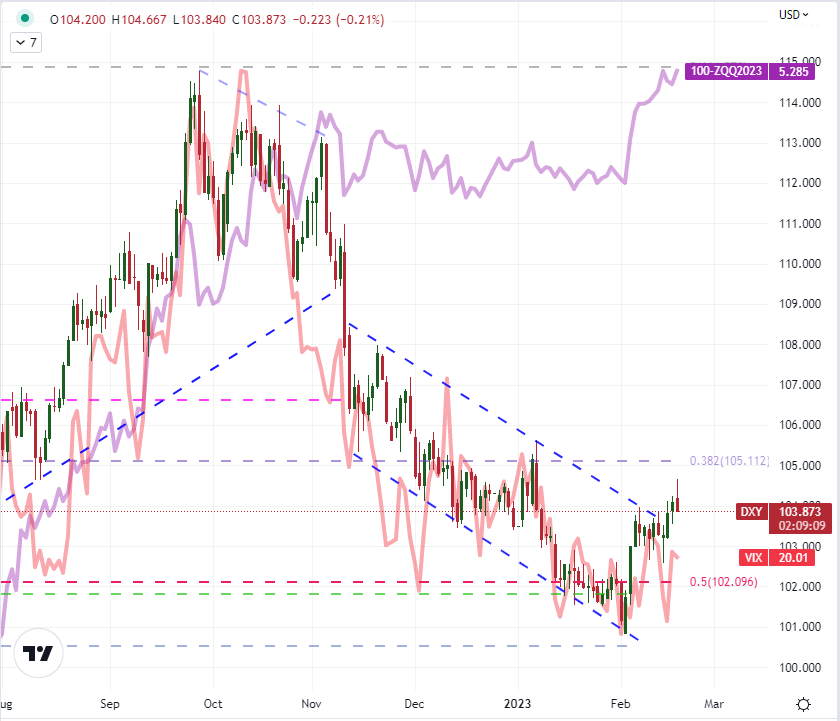
Chart Created on Tradingview Platform
Where the Dollar heads next is likely to tell us much about the backdrop of the broader global macro market. Yet, establishing conviction on that phase is clearly problematic. While I like the technical structure of pairs like USDCAD for range, USDMXN for the outlier anti-Dollar lean and USDJPY for its technical progress to the upside; these are conflicted views that don’t give a clear signal on the what the currency is intending. For me, the confirmation of a bullish/bearish/sideways course would be EURUSD. There is less ‘risk sensitivity’ to this cross, but that will give more ‘signal’ out of the noise of volatility. As for interest rate considerations, this is also paired to the ECB which is looking at once of the most hawkish forecasts left of the majors given their late start to tightening.
Chart of EURUSD with 20 and 100-Day SMAs, 10-Day Historical Range (Daily)
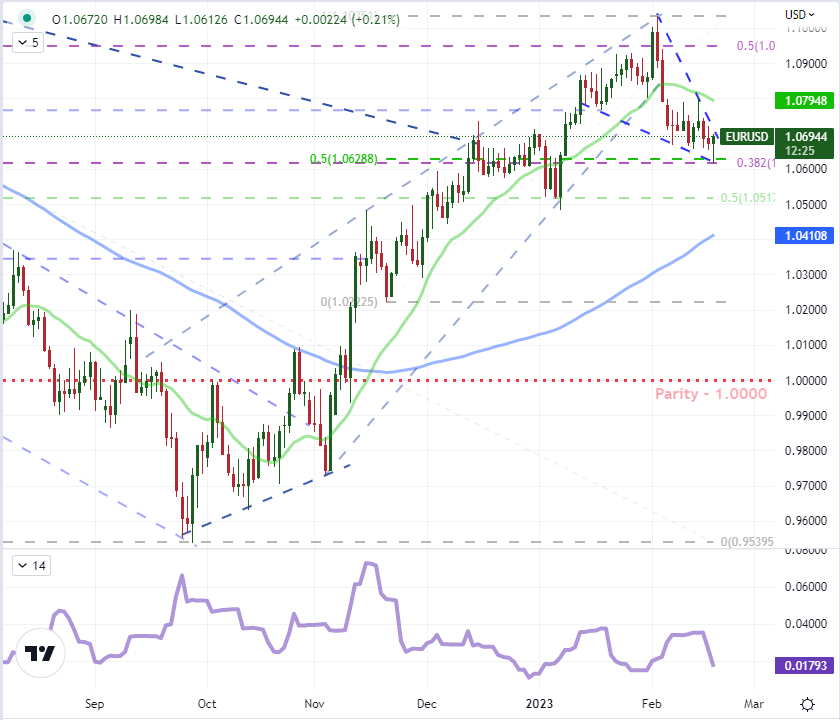
Chart Created on Tradingview Platform
For top tier event risk, the economic calendar has some particularly important listings that macro traders should monitor. First and foremost, Monday developments should be approached with caution. While the US is the only major market offline for the day (setting aside Canada, Brazil and a few others), it is large enough that it can have a disproportional impact on liquidity. Thinned liquidity can amplify volatility and the instance of false breaks. Tuesday, we will dip into a theme that has seen much less conversation in the mainstream: recession risks. The preliminary readings of February PMIs for the US, Eurozone, UK, Japan and Australia will give a broad view of the timely picture of global economic health. This series struggles for market influence, so significant deviations from forecast and particularly to the downside would be the most potent scenario. Through the rest of the week, we have highlights for regions, but nothing that seems to escalate to the level of global market moving – that is until Friday’s PCE deflator. The Fed’s favorite inflation indicator doesn’t get nearly the attention as the CPI; but if the official reading surprises, it could stir rate speculation to life. In this case, a significant cooling that contrasts the BLS number could batter the Dollar and potentially boost risk assets.
Top Global Macro Economic Event Risk for Next Week
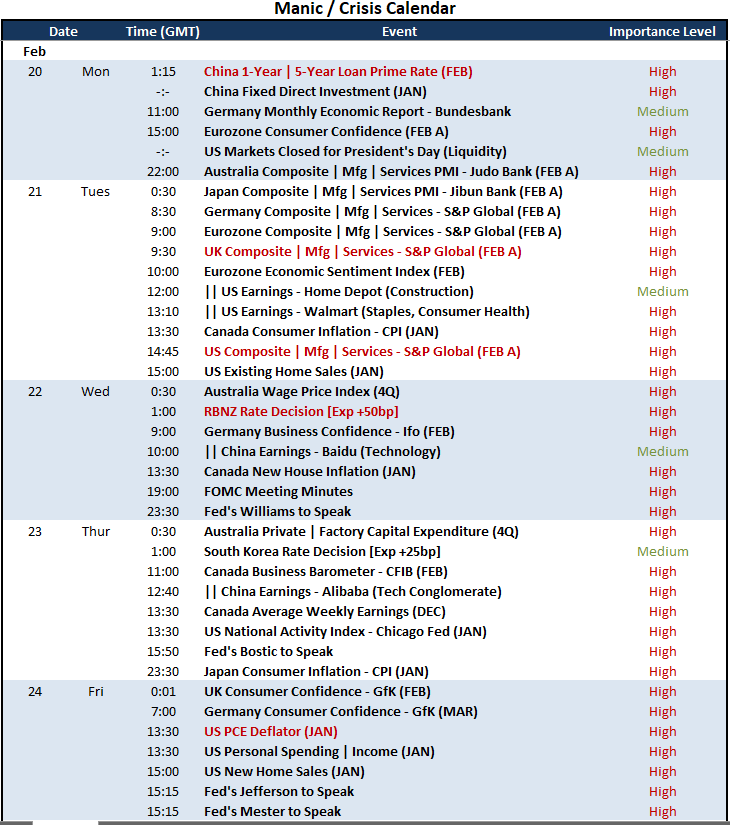
Calendar Created by John Kicklighter
A bonus chart for the week ahead is AUDNZD below. This applies to most Kiwi crosses, but be mindful of the cross you chose and its position on the risk scale as well as the event risk the counter currency faces; but the RBNZ rate decision could be a potentially potent market mover. The New Zealand central bank is expected to hike its benchmark another 50 basis points, but the market has already priced that in. Looking at swaps, the market believes that this group – which has historically kept its prime lending rate at a premium to global counterparts making it the go-to carry – is near the end of its regime. That allows for considerable speculation to shorten or lengthen the forecast. I like AUDNZD specifically because of the clean technicals and the stripped down fundamental contrast between the two currencies which are both considered ‘carry’ and have a strong economic correlation.
Chart of AUDNZD Overlaid with AU-NZ 2-Year Yield Differential and 20-Day Correlation (Daily)
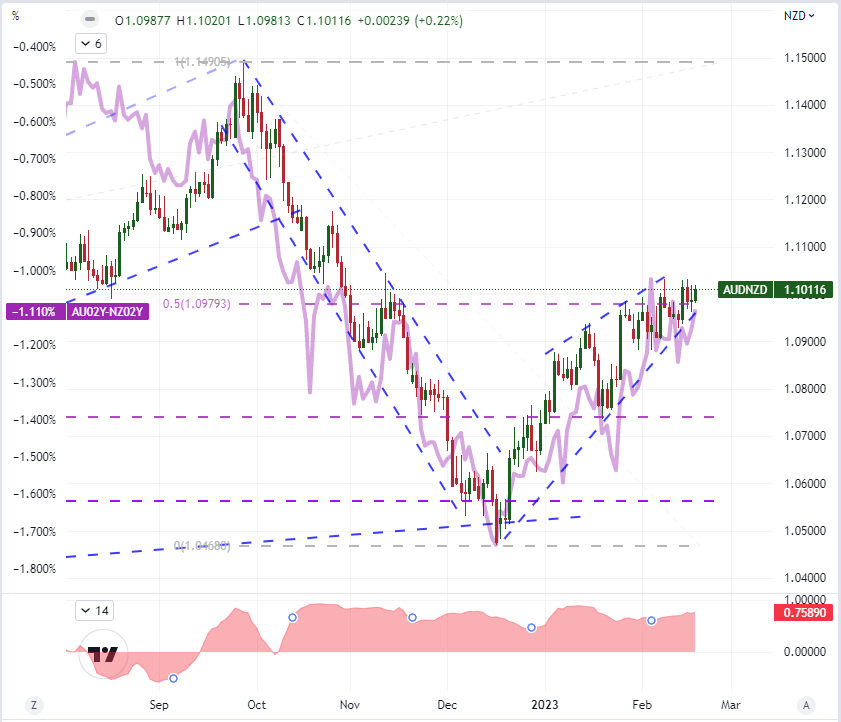
Chart Created on Tradingview Platform
Trade Smarter - Sign up for the DailyFX Newsletter
Receive timely and compelling market commentary from the DailyFX team


