


Gold Talking Points:
- Gold prices set a fresh five-month-high this morning on the back of a weaker-than-expected CPI report out of the US.
- Ahead of the move, Gold prices had pulled back to a key spot of support, which led to this morning’s bullish move up to fresh five-month-highs, but at this point, prices are pulling back below a key level of resistance, putting emphasis on today’s close ahead of tomorrow’s FOMC rate decision.
- The analysis contained in article relies on price action and chart formations. To learn more about price action or chart patterns, check out our DailyFX Education section.

It was a brutal trend for Gold bulls through the first ten months of this year but, since the November open, the shoe has been on the other foot. Gold prices have now almost retraced almost 45% of the 2022 sell-off since finding a low in early-November.
Gold Weekly Chart
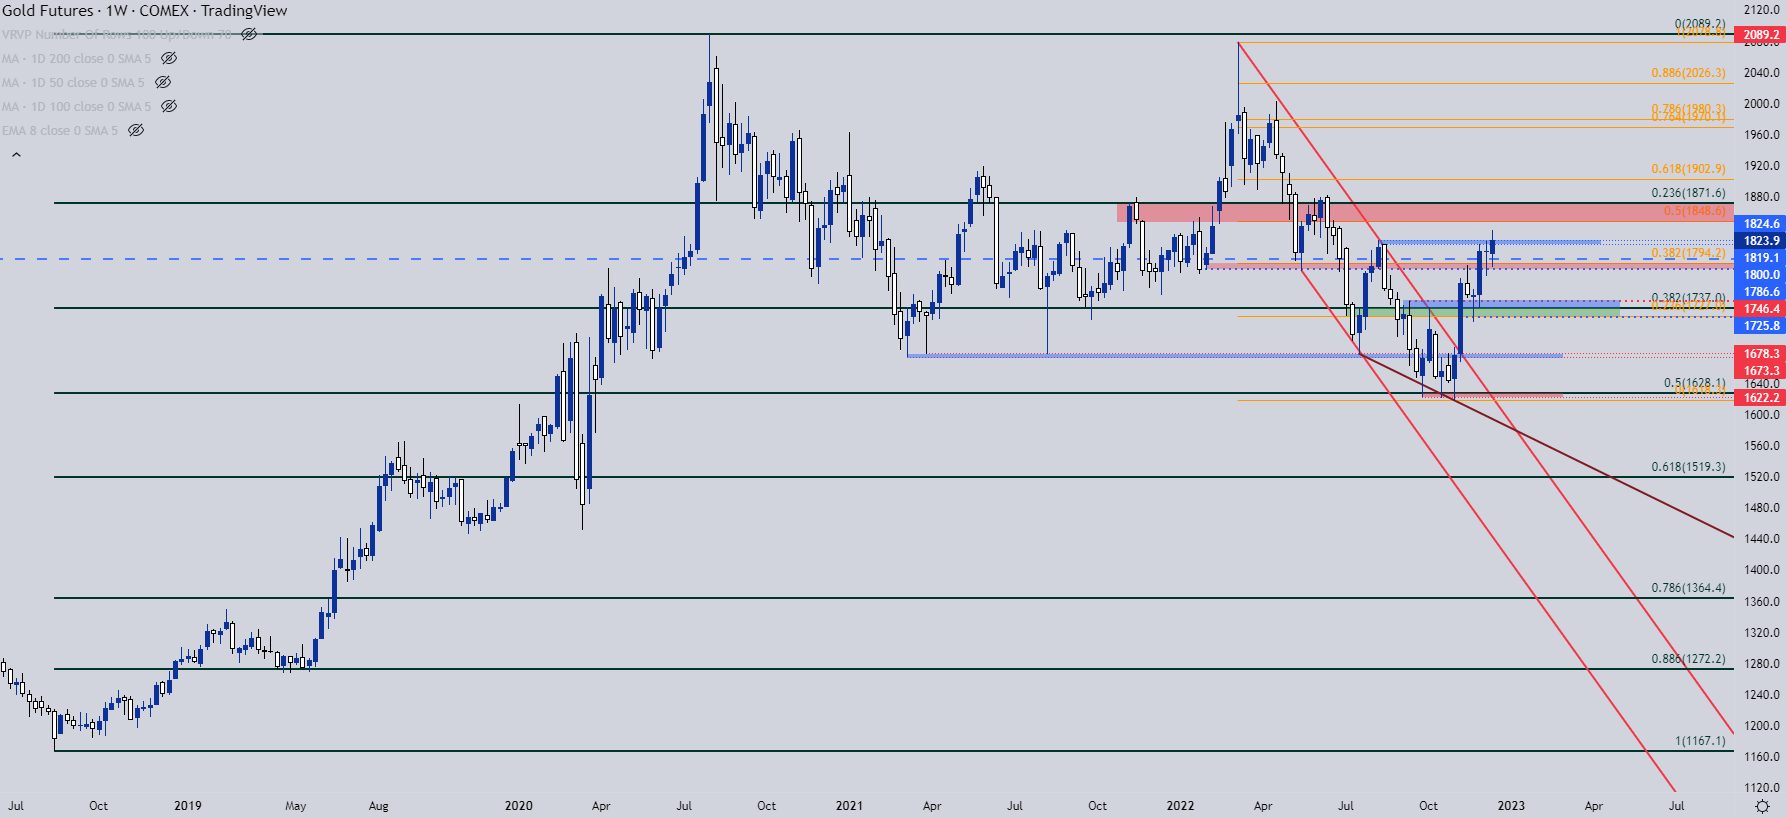
Chart prepared by James Stanley; Gold on Tradingview
I had looked into reversal potential at that point, as sellers were continually stymied at a big area of support around a longer-term Fibonacci level plotted at 1628. There were failed breakdown attempts at that price in late-September, mid-October and then again in early-November; with the last episode quickly leading to a resistance test at a trendline that had held the highs since February.
The breakout from that formation hit a month ago, and since then it’s been a continuation of higher-highs and higher-lows with yesterday showing the most recent iteration, as buyers held support at a key spot of prior resistance plotted at 1791.

Gold Daily Price Chart
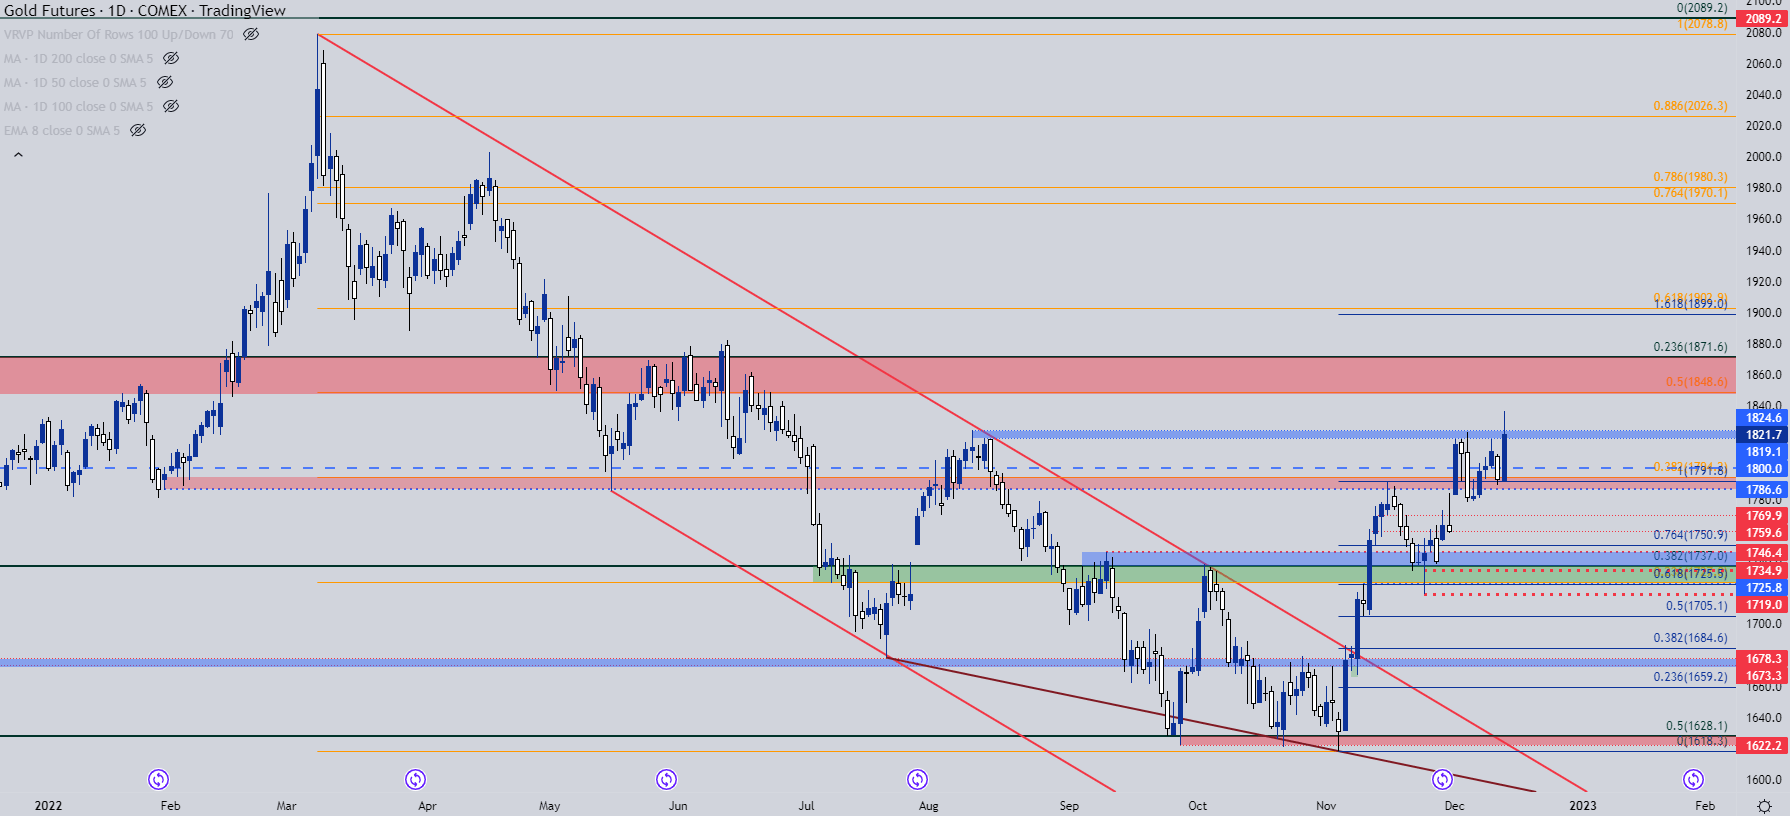
Chart prepared by James Stanley; Gold on Tradingview
Gold Breakout Test – Can it Hold?
Gold prices got another shot-in-the-arm in early-December, pushing above the 1800 psychological level and eventually finding resistance in a block of prior swing highs, plotted from around 1819 to 1824. This was the same spot of resistance that caught the highs in August before the sell-off pushed down to that key support test at 1628, just before the November reversal began. Bulls shied away from a re-test of this zone last Friday, but this morning’s move saw prices breach-above before pulling back. And at this point, buyers are trying to hold support in that same spot, on a short-term basis.
For bullish continuation scenarios, if buyers can hold the higher-low, whether its in the 1819-1824 zone or whether its above the 1800 psychological level, the next major spot on the chart is 1848, which is the 50% marker of this year’s major move.
Gold Four-Hour Chart
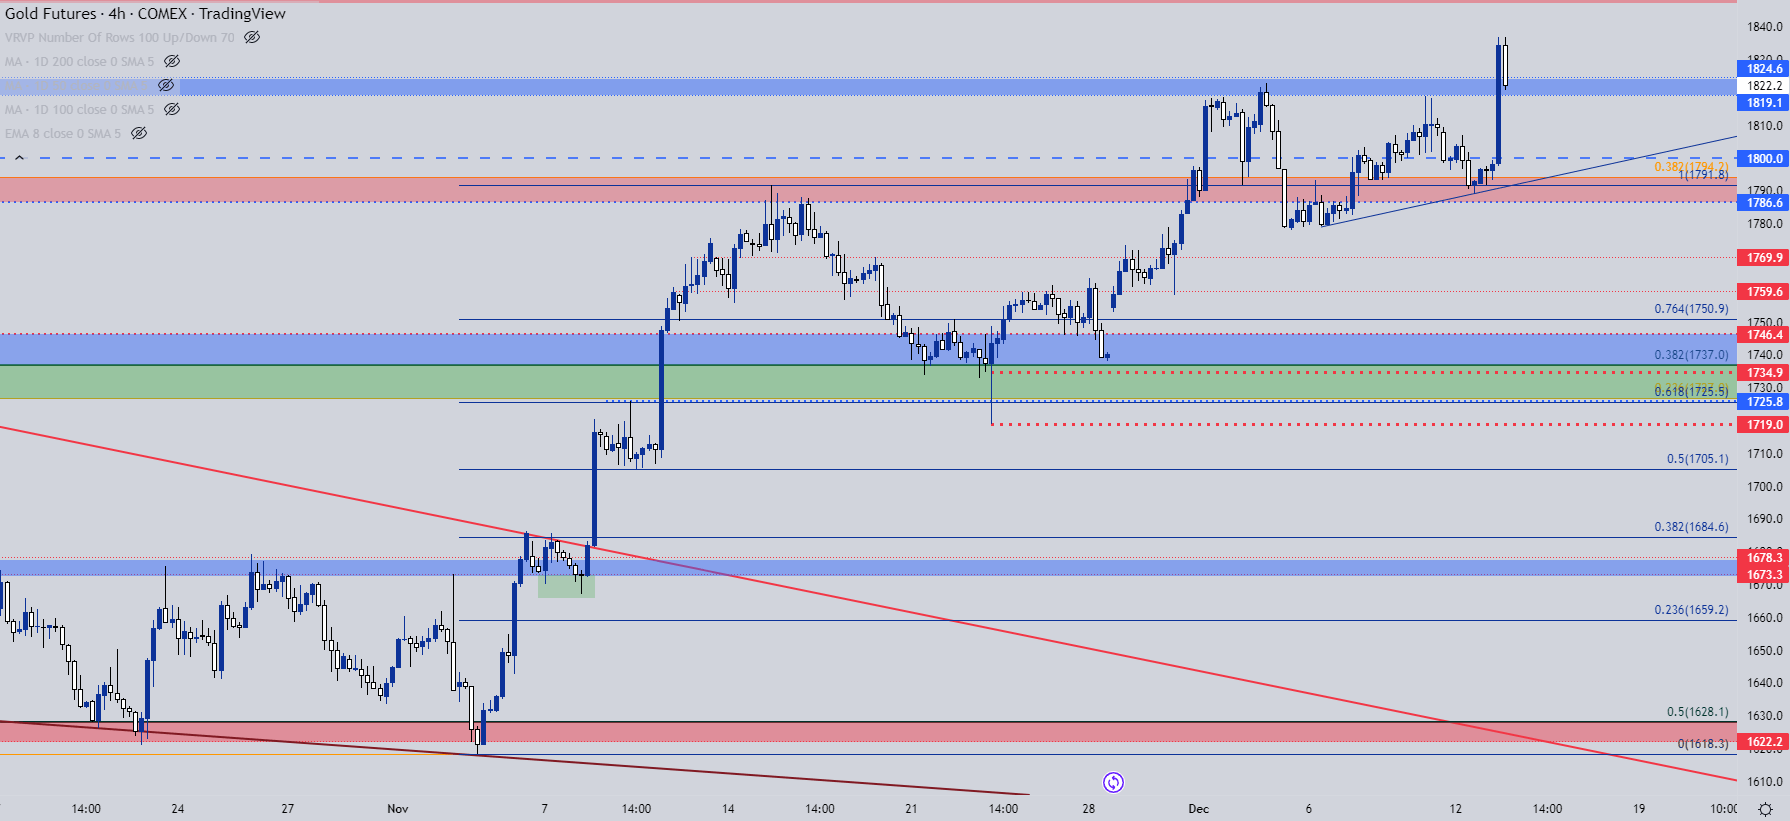
Chart prepared by James Stanley; Gold on Tradingview
Gold Reversal Potential
The trend in Gold has been going for almost a month-and-a-half now and after a hold at 1794, which is the 38.2% Fibonacci retracement of this year’s major move, the door is open for a re-test of the 50% mark of that same study that plots at 1848. That will be a big test but it’s worth noting that until price crosses that 50% marker, there could be some remaining bearish qualities here, particularly if we start to see reversal signs stacking up.
A failure to hold support above 1819 will expose and elongated wick on today’s daily chart, and that could be an open door to step one of a reversal scenario in Gold. This would require a daily close inside of that resistance zone, thereby giving the appearance of bullish capitulation after the test of resistance came into play.
The initial move on something of that nature could look for a re-test of the 1800 level, at which point continued bearish action could keep the door open for a deeper reversal scenario.

Gold Daily Chart
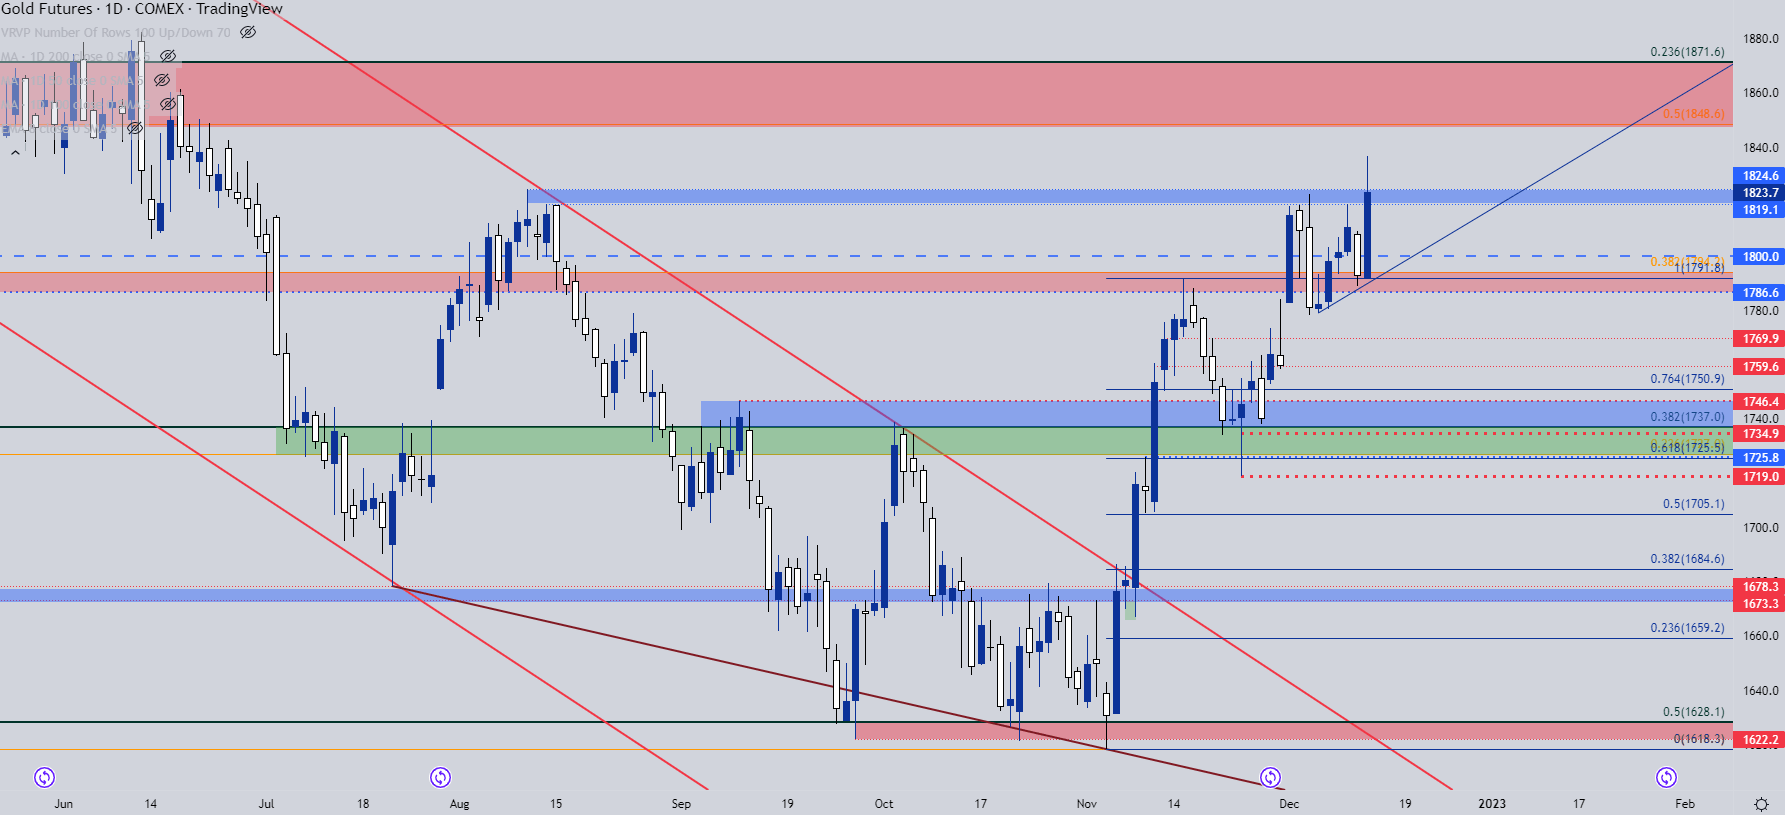
Chart prepared by James Stanley; Gold on Tradingview
--- Written by James Stanley, Senior Strategist, DailyFX.com & Head of DailyFX Education
Contact and follow James on Twitter: @JStanleyFX


