


Gold Talking Points:
- Gold prices put in a strong breakout after a failed breakdown earlier in November.
- Last week saw the bullish move grind to a halt after a key spot of resistance came into play at 1786-1794. That has since led to a pullback – but is that pullback the re-starting of the bigger-picture bearish trend or a mere pause in a building bullish theme?
- The analysis contained in article relies on price action and chart formations. To learn more about price action or chart patterns, check out our DailyFX Education section.

Gold prices sit at an important precipice.
The bullish move that started in November remains alive but ever since resistance came into the equation last Tuesday, bears have been making a move and prices in Gold have already pushed below a couple of key support levels. There’s more support potential a little lower, around 1725-1727, but Gold bears are now working on their fourth consecutive day of losses and given related themes in rates and the US Dollar, the fundamental backdrop may be shifting in a less-friendly manner for bulls.
I had looked into gold prices coming into the month of November, highlighting bullish potential as price action had built a falling wedge formation while holding and respecting a key spot of support. Prices put in a strong bounce a couple of days later, following another failed breakdown at 1622, and that led to a visit to resistance, as taken from a bearish trendline connecting February and October swing-highs.
The following Monday saw continued grind at that level but the next day led to a strong topside breakout and that move ran for the rest of the week. Gold bulls even continued the move into the next week, which was last week, until resistance finally started to come into the equation around the same 1786-1794 zone that was support in February and May of this year.
Gold Daily Price Chart
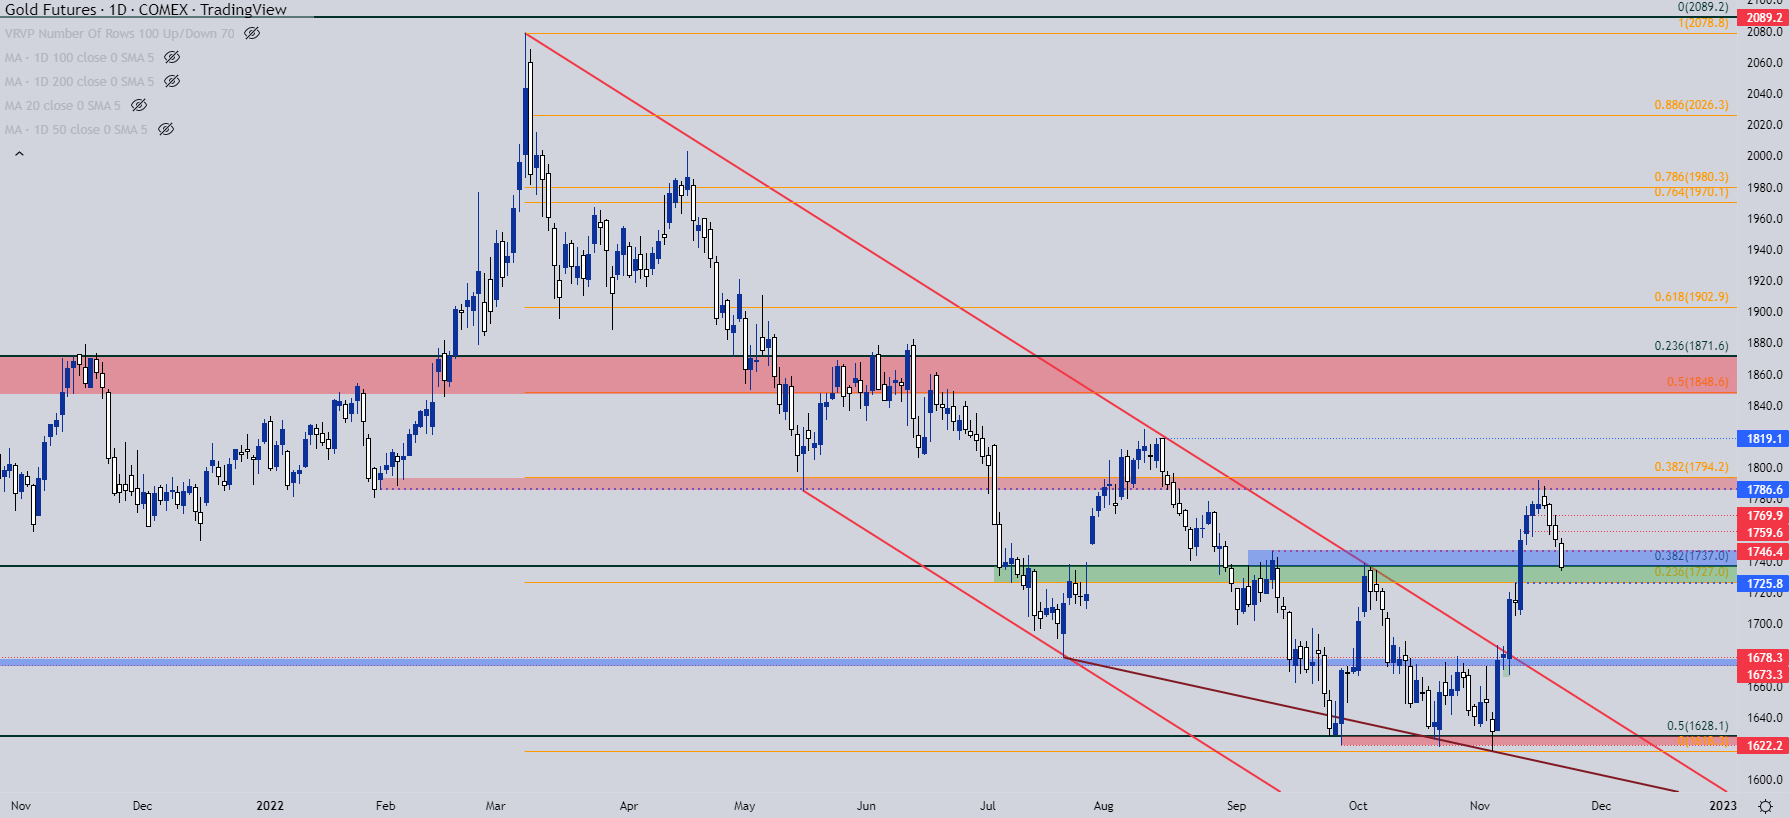
Chart prepared by James Stanley; Gold on Tradingview
Gold Trends
The intermediate-term trend of strength is now in question after prices have pulled back by more than $50 from that resistance inflection last week. The longer-term trend still remains bearish in nature and the big question is whether that’s on the way back as short-term weakness prods a deeper pullback in Gold prices.
At this point, there’s a juncture of support that’s at work and if bulls can defend this, the intermediate-term bullish trend holds some potential for continuation.
At this stage, Gold prices have retraced more than 23.6% of that prior bullish move but, as yet, hasn’t encountered the 38.2% Fibonacci retracement of that move. That level lines up at a familiar spot of 1725 which was a prior swing high – and that’s right below another Fibonacci level of note at 1727. Collectively, this makes for a support zone of interest for bulls as a hold there shows as a longer-term higher-low.
But, if buyers can hold that support, the next level of note is around the 50% mark of that same Fibonacci study at 1705, and a break-below that puts control back to the bears.
Gold Four-Hour Price Chart
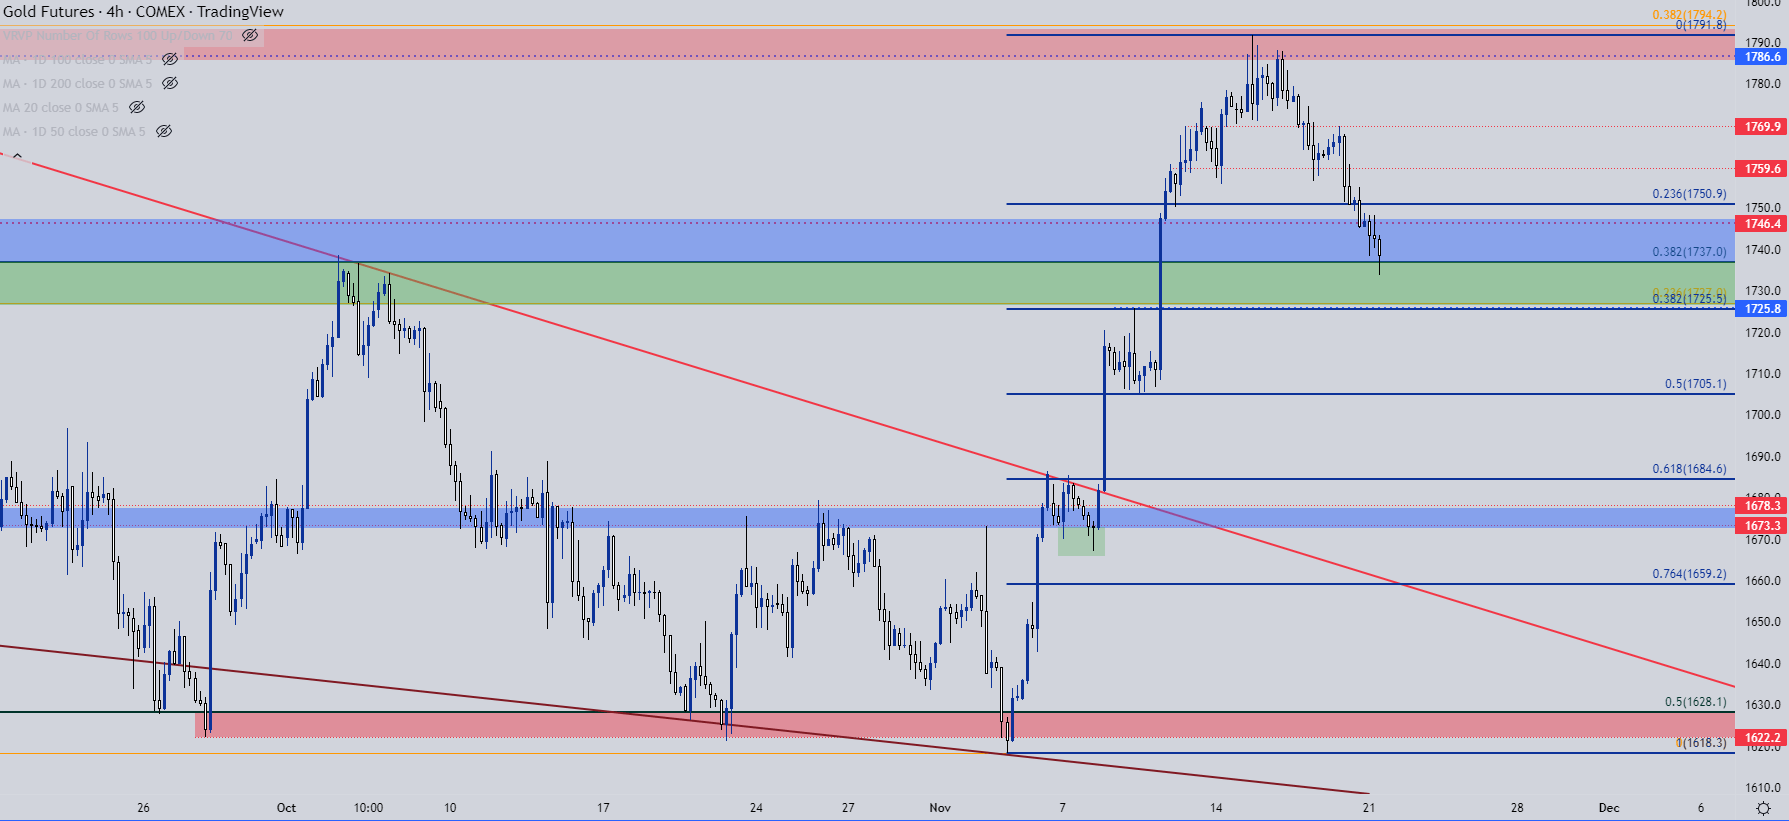
Chart prepared by James Stanley; Gold on Tradingview
Gold Shorter-Term
So, is this a reignition of the longer-term bearish trend or continuation of the shorter-term bullish move? From longer-term charts, the prospect of a bearish swing looks attractive while the daily chart illustrates bullish potential, given the test of support at prior resistance and if that holds, confirmation of a higher-low after a recent higher-high.
I’m going to draw back to the daily chart for this as I believe that’s providing the most clarity at the moment. And as long as price holds above the 38.2% retracement of the recent breakout, that door for bullish trend continuation can remain open. This will likely be contingent on USD-weakness returning which would likely have some tied relationship to rates.
But – if bears take out that support and perhaps more importantly – if they take out the 50% mark of that recent retracement, then bulls have failed to hold the move and then attention goes back on the short-side of the matter. Below 1705, there’s longer-term support potential at prior resistance, from the same spot I was using to spot the breakout back in early-November, plotted from around 1673-1678.

Gold Daily Price Chart
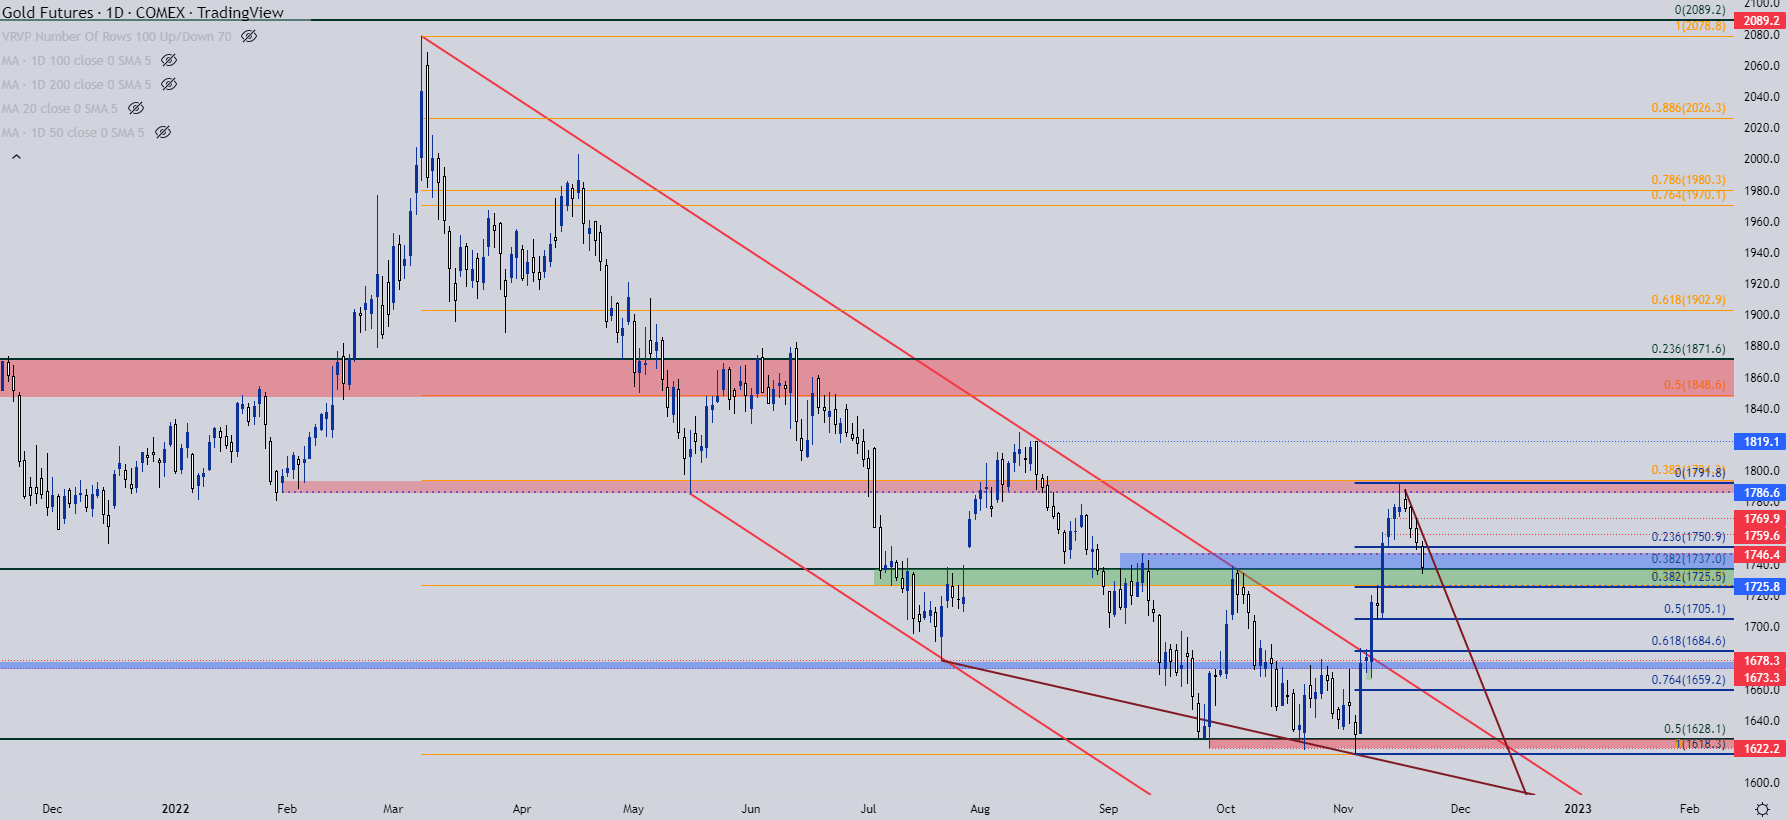
Chart prepared by James Stanley; Gold on Tradingview
--- Written by James Stanley, Senior Strategist, DailyFX.com & Head of DailyFX Education
Contact and follow James on Twitter: @JStanleyFX


