


US Dollar Technical Forecast: Bullish
- The US Dollar put in bounce last week after a sizable move lower the week before, begging the question as to whether the near-term low is now in-play.
- EUR/USD strength ran into a wall before the 1.0500 handle and GBP/USD found resistance at the 1.2000 level; each of which can bring swing potential into the equation.
- The analysis contained in article relies on price action and chart formations. To learn more about price action or chart patterns, check out our DailyFX Education section.

Has the US Dollar found a low?
It was only last month that we were asking whether the USD had topped. That was around the time that the Greenback printed a double top formation that was quickly filled as a new bearish trend began to emerge and over the past couple of weeks, US Dollar bears have been in the driver’s seat as the massive move of USD strength that ran through the summer has been further priced-out.
The big question is whether the short-term bearish trend has met its end which could enable the bigger picture bullish trend to get back on its upward trajectory.
From the daily chart below, the answer to that question would be inconclusive. There is possible reference for a low in place and that’s largely taken from the extended wick on last Tuesday’s candle. That illustrates a reaction from bulls and the fact that it led to a series of higher-lows into the end of the week highlights that growing bullish expectation.
But – bulls didn’t exactly run with the matter as short-term resistance continued to hold the highs and this is around the 107.27 level that I had looked at on Thursday.
US Dollar Daily Chart
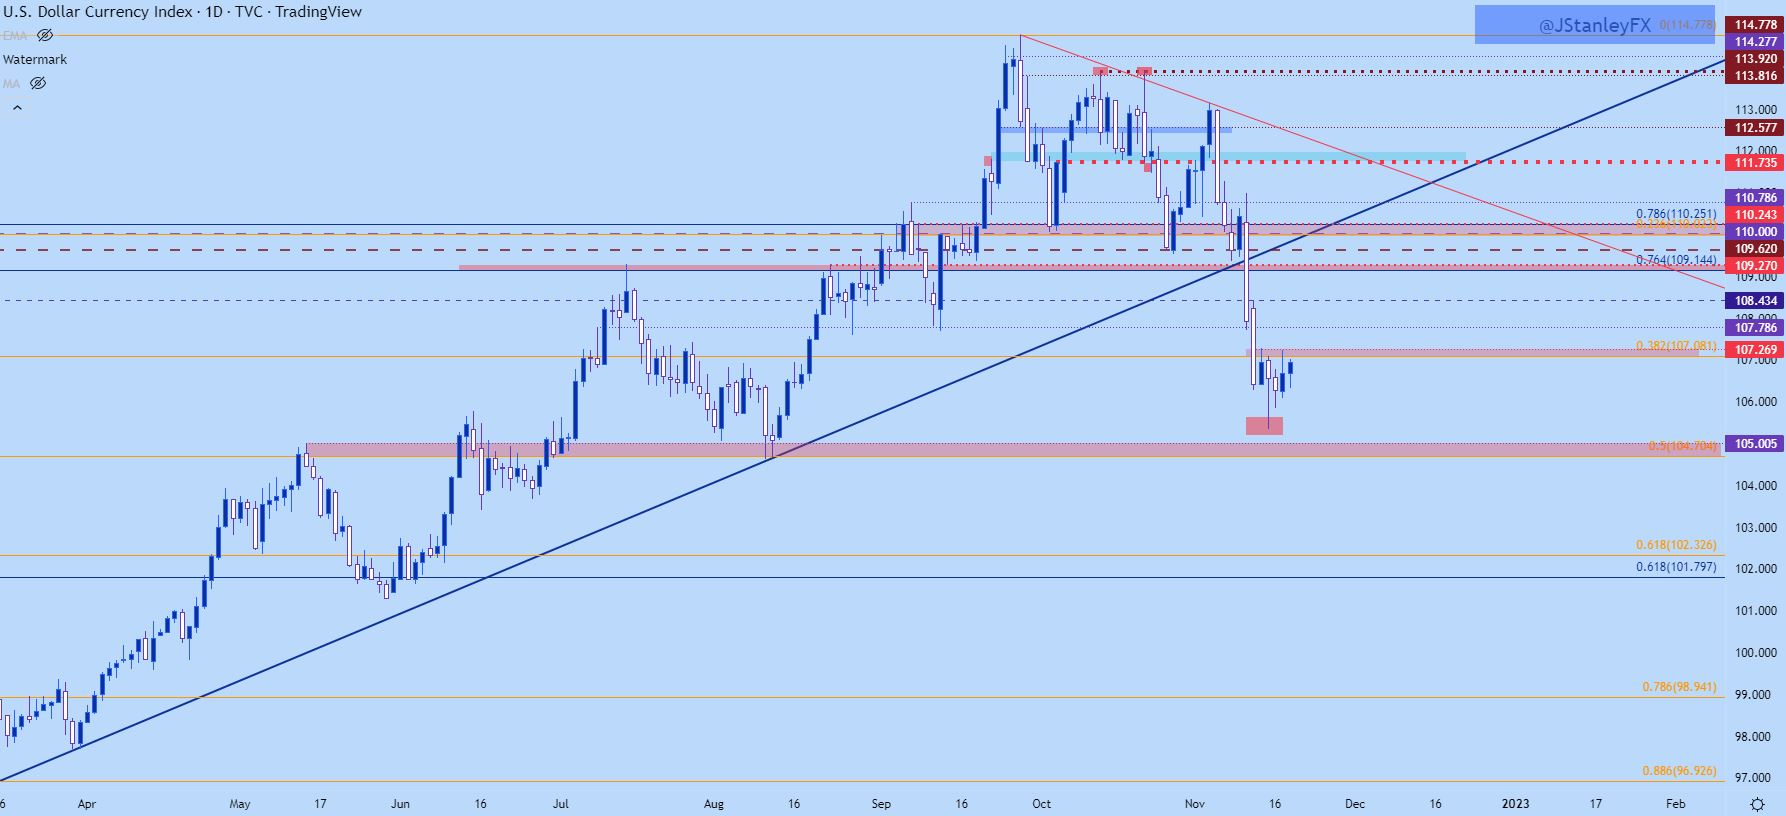
Chart prepared by James Stanley; USD, DXY on Tradingview
USD Weekly Chart
Last week’s bar has the tone of indecision. It’s not quite a doji but perhaps even wider than what would be desired for a spinning top. But, the underside wick with a bullish close illustrates how the Tuesday bounce helped to stem the bleeding, at least temporarily, as buyers started to show a heavier hand. The big question, of course, is one of continuation and bulls are going to need to push above that resistance zone to continue the move, after which topside levels come into play at 107.79 or 108.43.
US Dollar Weekly Chart
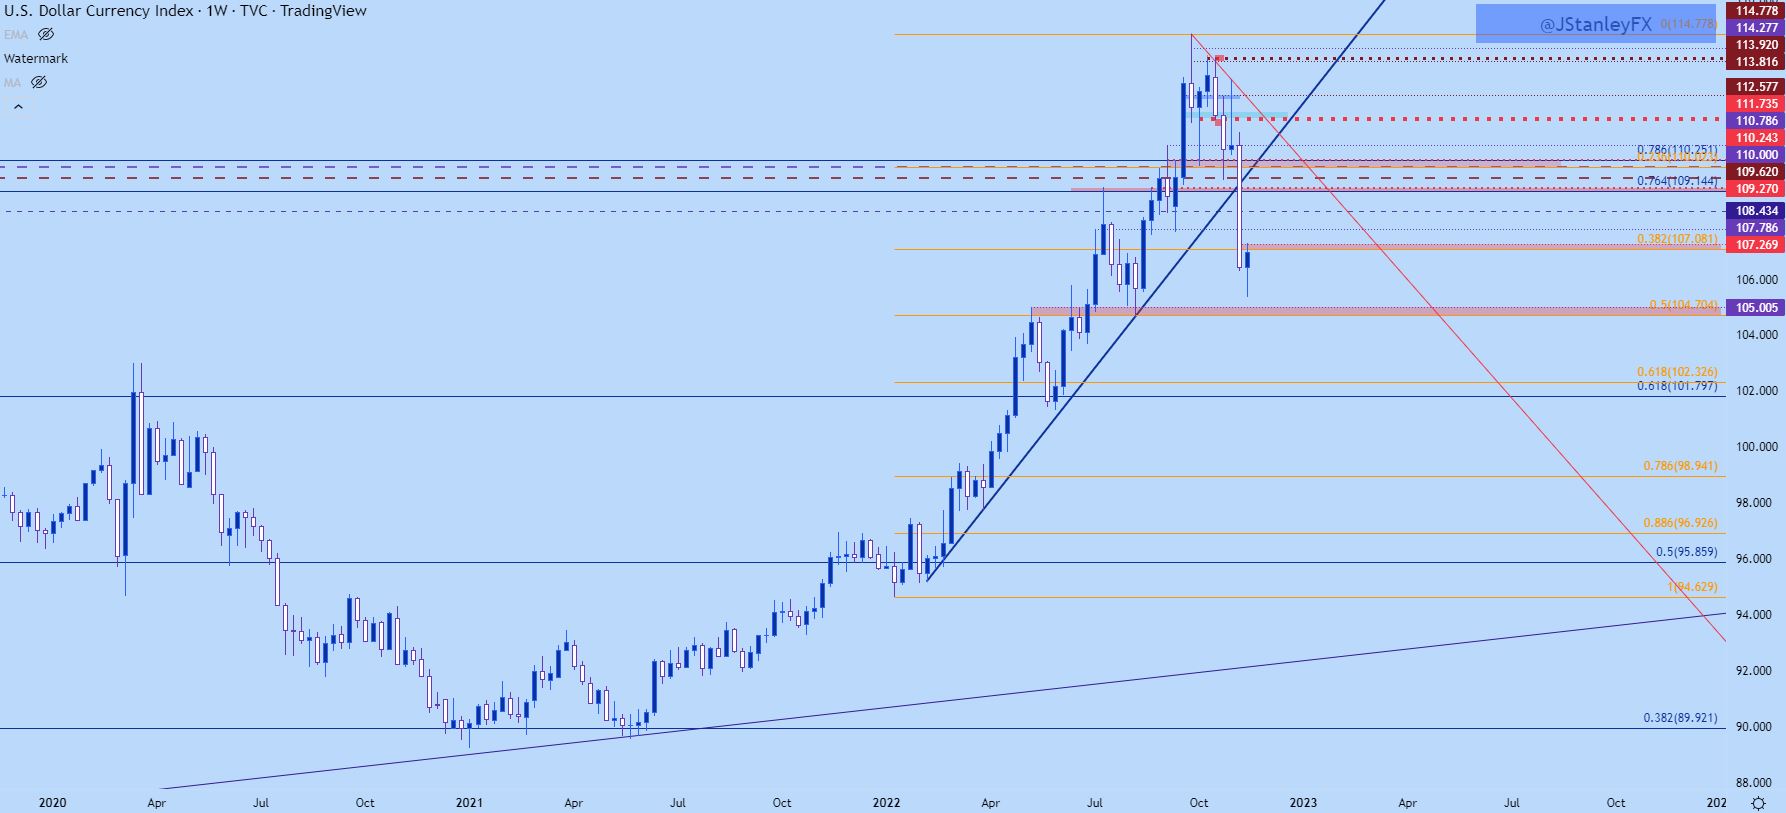
Chart prepared by James Stanley; USD, DXY on Tradingview
USD Shorter-Term
I had looked into the US Dollar on Thursday, highlighting that short-term resistance at 107.27 that needed to be broken-through for continuation scenarios. By the end of the week, that fact remained and bulls hadn’t yet tested above resistance. But, deductively, that door remains open, as price built a series of higher-lows helping to make an ascending triangle formation which retains short-term bullish breakout potential.
Of course, as has been central in these topics of late, EUR/USD will likely have a large role in how the matter plays out and I’ll look at that next.
US Dollar Two-Hour Price Chart
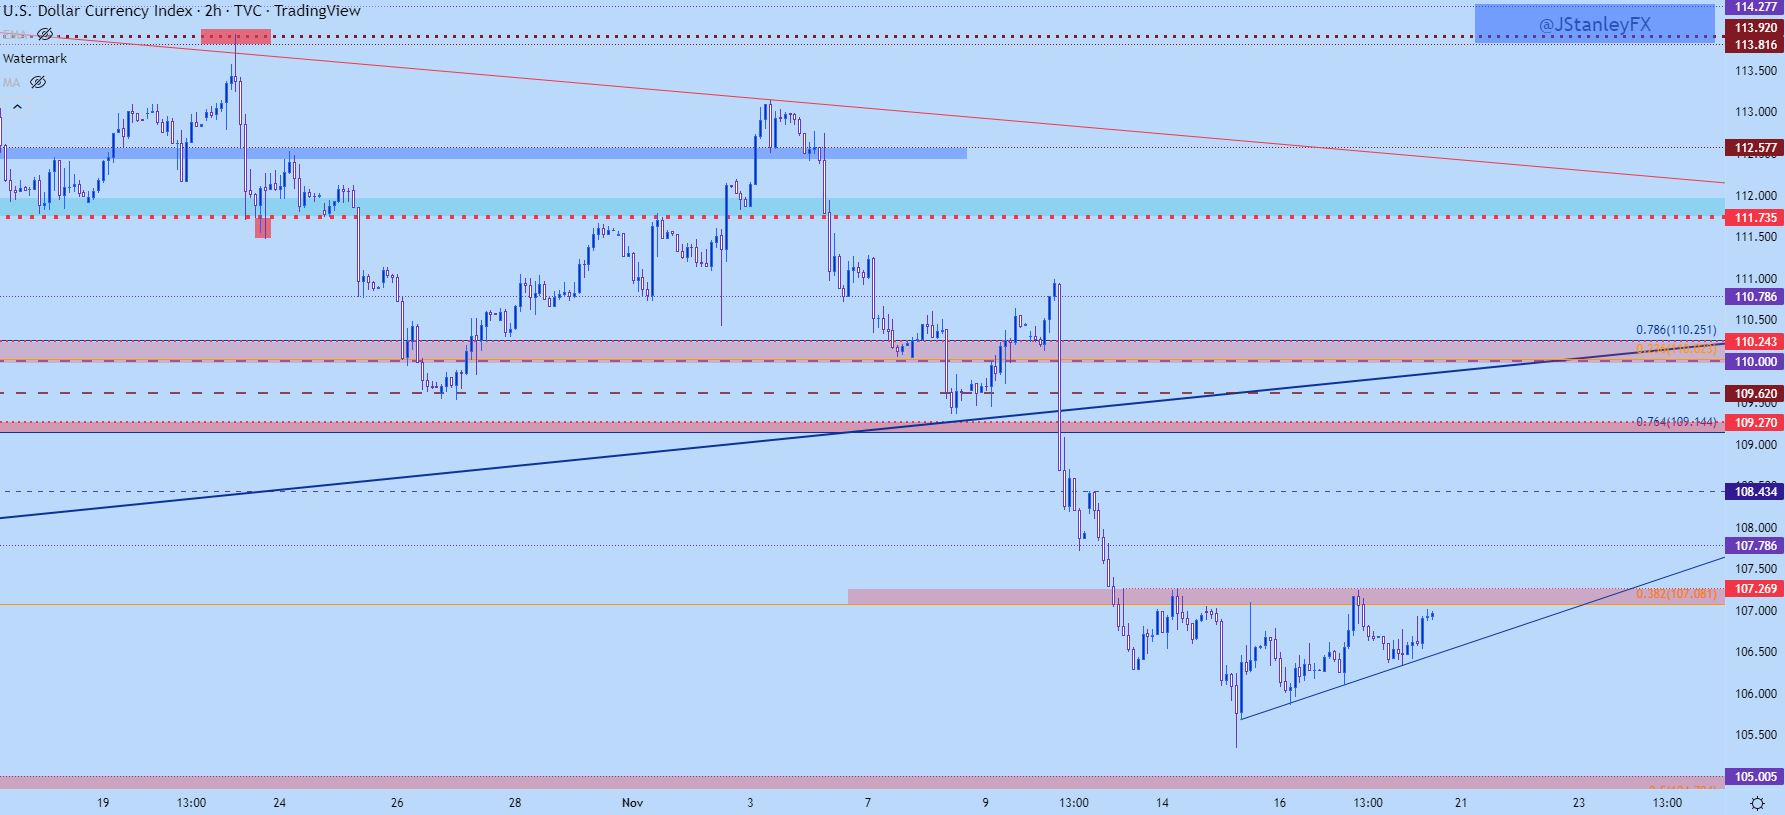
Chart prepared by James Stanley; USD, DXY on Tradingview
EUR/USD
If the US Dollar has bottomed, we’re likely going to need to see a top in EUR/USD. And like USD above, that’s still an inconclusive matter as bears didn’t exactly take the steps necessary to open the door to bearish trend potential.
But – there is potential for a reversal, and that’s something that can start to open the door to bearish themes. I had looked into the matter on Friday while highlighting consolidation around a major level of 1.0350. That price helped to set support in 2017 and then came back into the picture as a major level this summer, setting support in May and June before popping up as resistance in August.
That level is where last week’s candle body resides, with extended wicks on either side to make for a doji formation.

EUR/USD Weekly Chart
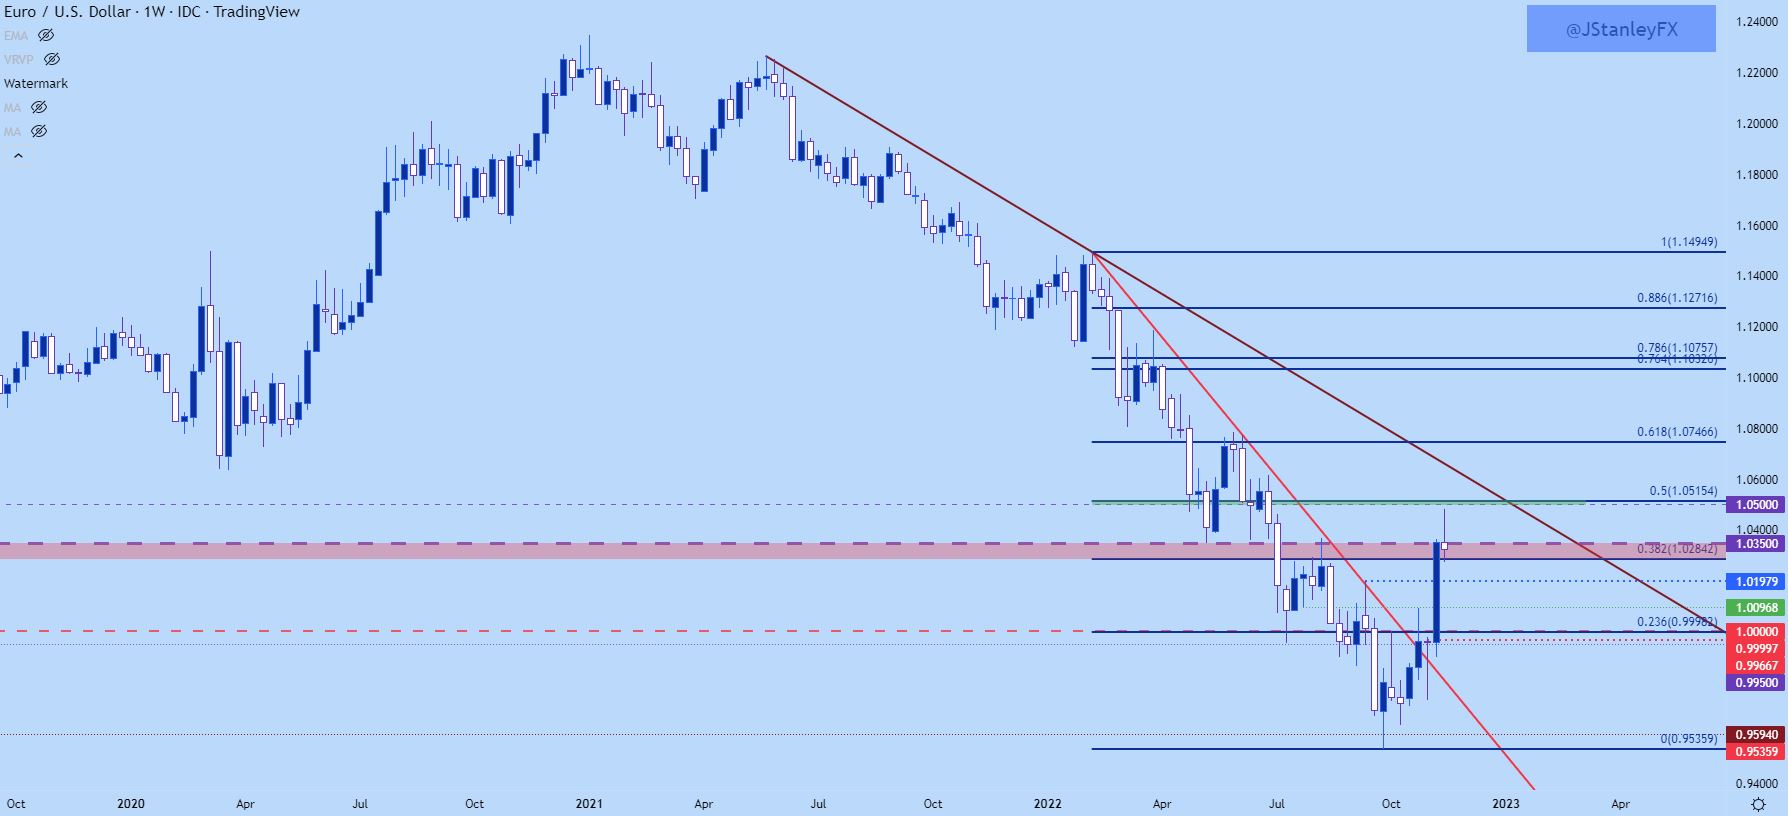
Chart prepared by James Stanley; USD, DXY on Tradingview
EUR/USD Shorter-Term
Last week saw quite a bit of gyration in EUR/USD and this led to the build of a symmetrical triangle, which, in and of itself carries no directional bias. But – when paired up with the bullish move that led to the build of the formation can be qualified as a bull pennant formation. This is usually approached with the aim of bullish continuation. But, even that may have some knock-on consequences for bears.
If prices do pose a topside breakout, the 1.0500 level sits just overhead and this may be an area of interest for bears looking to plot reversal strategies.
On the bearish side, the Fibonacci level at 1.0282 remains pertinent as this helped to set the low on Monday and Tuesday of last week: A breach below that marks a fresh weekly low and that can be the fresh lower-low that bears are looking for to trigger into bearish scenarios.
EUR/USD Daily Chart
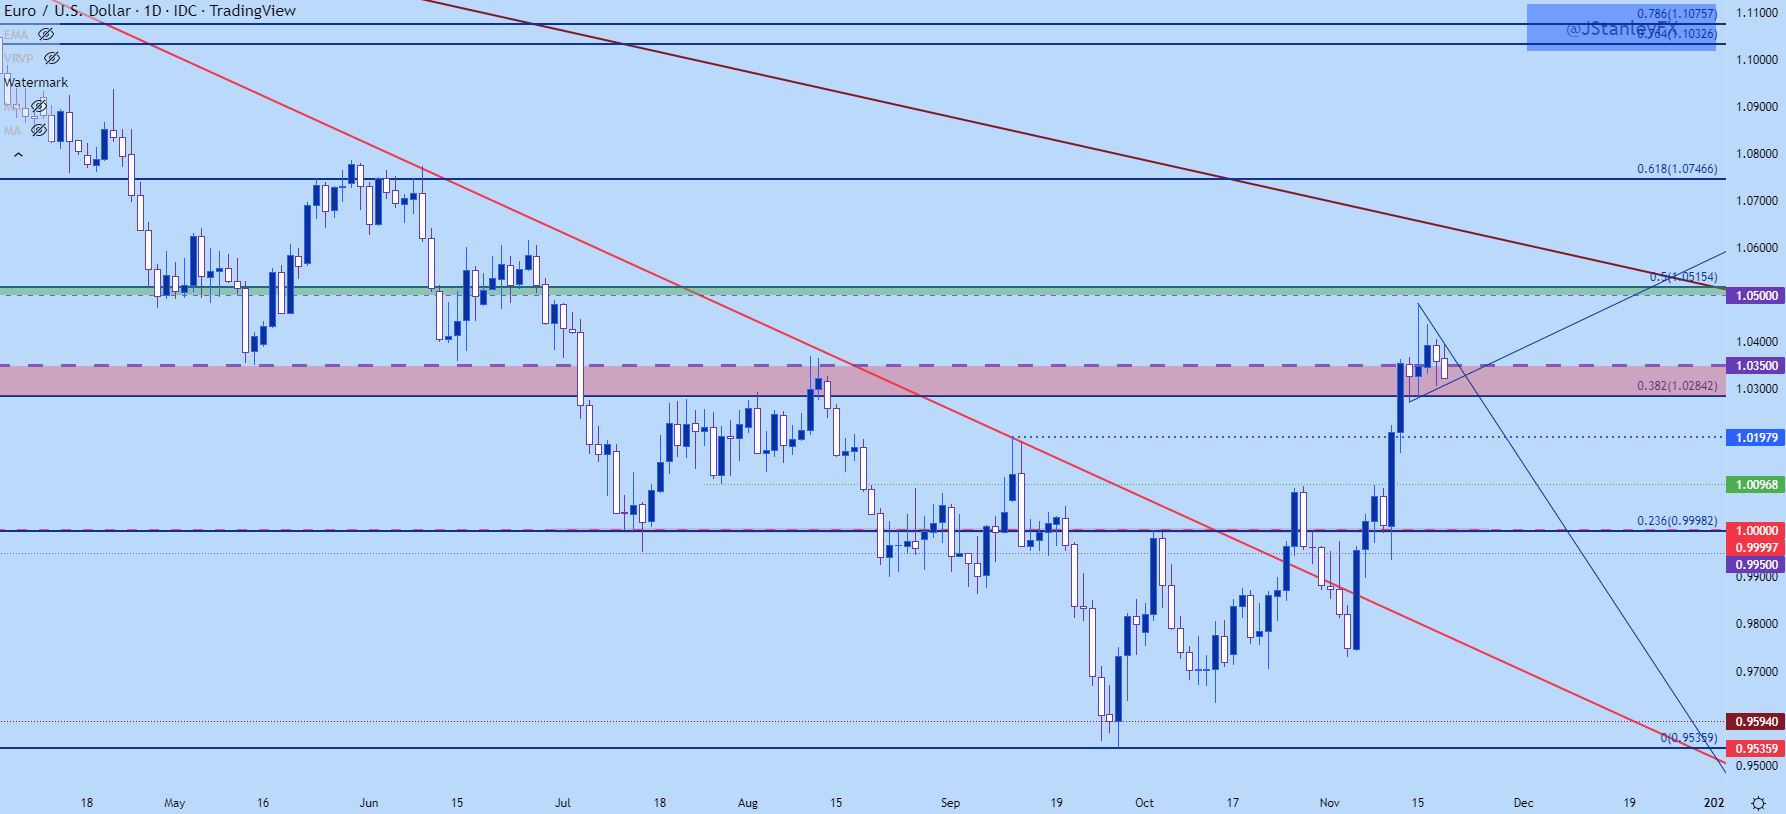
Chart prepared by James Stanley; EURUSD on Tradingview
GBP/USD
Volatility in Cable over the past couple of months has been quite elevated. It was late-September when the collapse-like move was showing. But, as USD strength started to get priced-out, shorts hurriedly covered and GBP/USD put in an extremely strong showing coming into last week.
And while many were calling for parity just a month earlier, GBP/USD pushed up to the 1.2000 psychological level on Tuesday of this week before finding sellers. This is a significant level for GBP/USD, as it was support in 2016 and 2017, and then again in 2019 before coming back in the picture earlier this year.

GBP/USD Monthly Price Chart
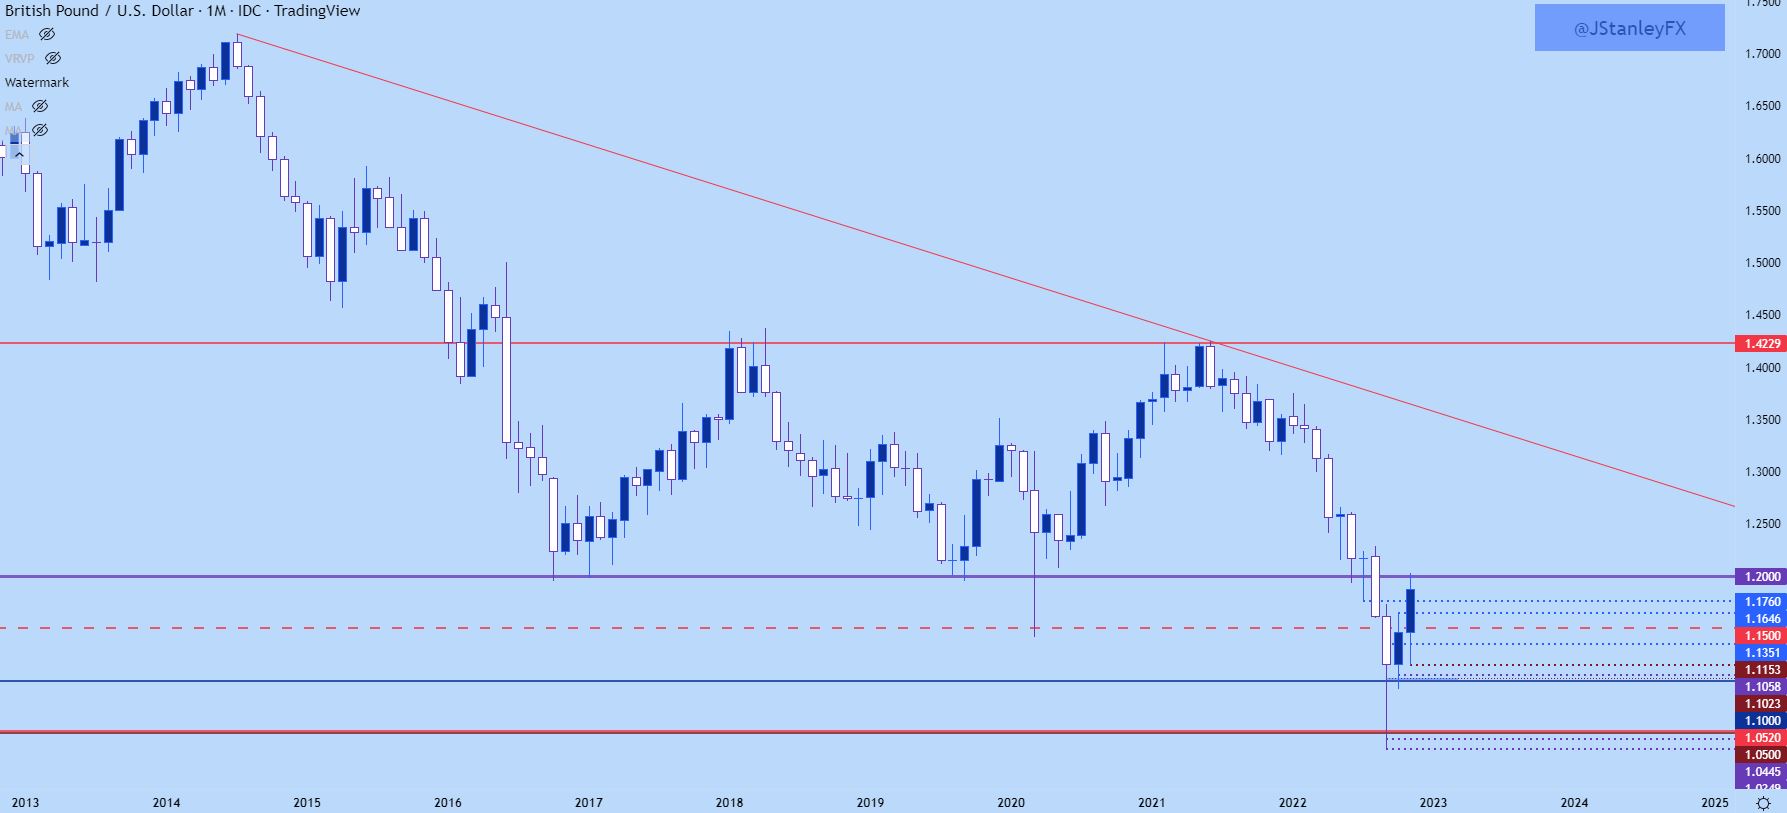
Chart prepared by James Stanley; EURUSD on Tradingview
GBP/USD Shorter-Term
From the daily chart we can get a better view of that 1.2000 resistance inflection and that led to a support test on Thursday at the 1.1760 level. That helped to hold the lows into the end of the week so similar to EUR/USD above, there’s a bit of patience that’ll be needed from bears as there’s not quite a lower-low to go along with that possible lower-high. But, a breach below 1.1760 can open that door, and the next support level below that is at 1.1646, after which the 1.1500 level comes back into the equation.
GBP/USD Daily Chart
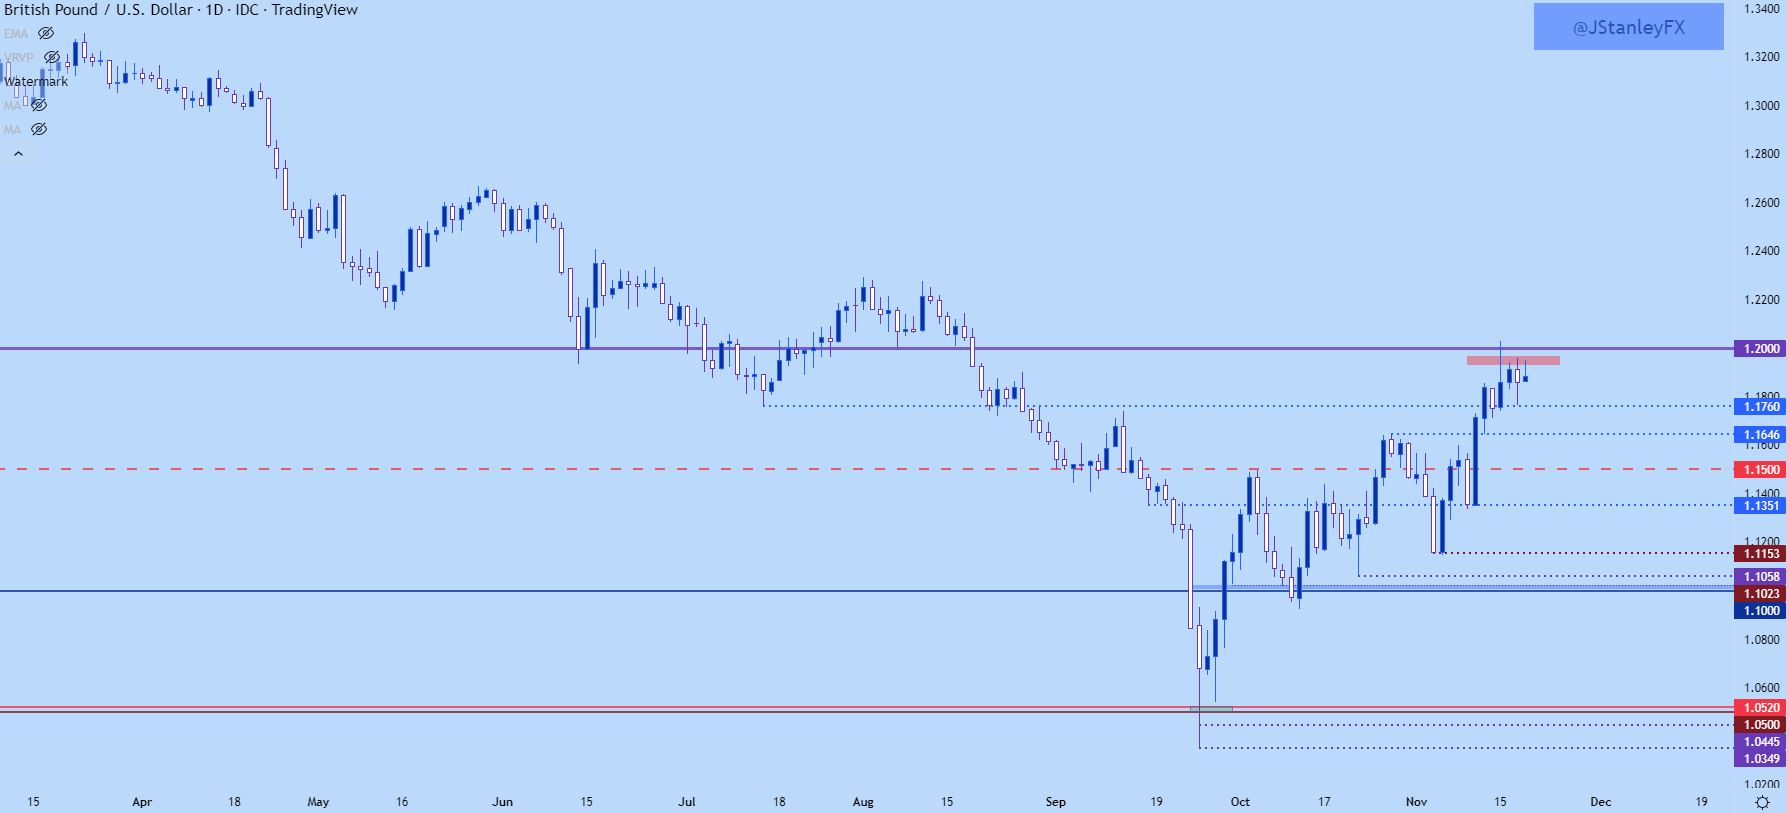
Chart prepared by James Stanley; GBPUSD on Tradingview
USD/CAD
I had looked into USD/CAD on Wednesday, highlighting a key spot of support at the 1.3250 psychological level that was holding the lows in the pair. That led to strength as price pushed back above the 1.3350 level; and after a pullback with a print at a higher-low, bulls pushed up to another high.
This keeps the door open for bullish trends in USD/CAD. There’s a large area of resistance sitting overhead at the 1.3465-1.3500 area. This was support in October and early-November, so the next push up to resistance in that area could be looked to for pullback potential, after which higher-low support potential comes back into the equation.

USD/CAD Four-Hour Price Chart
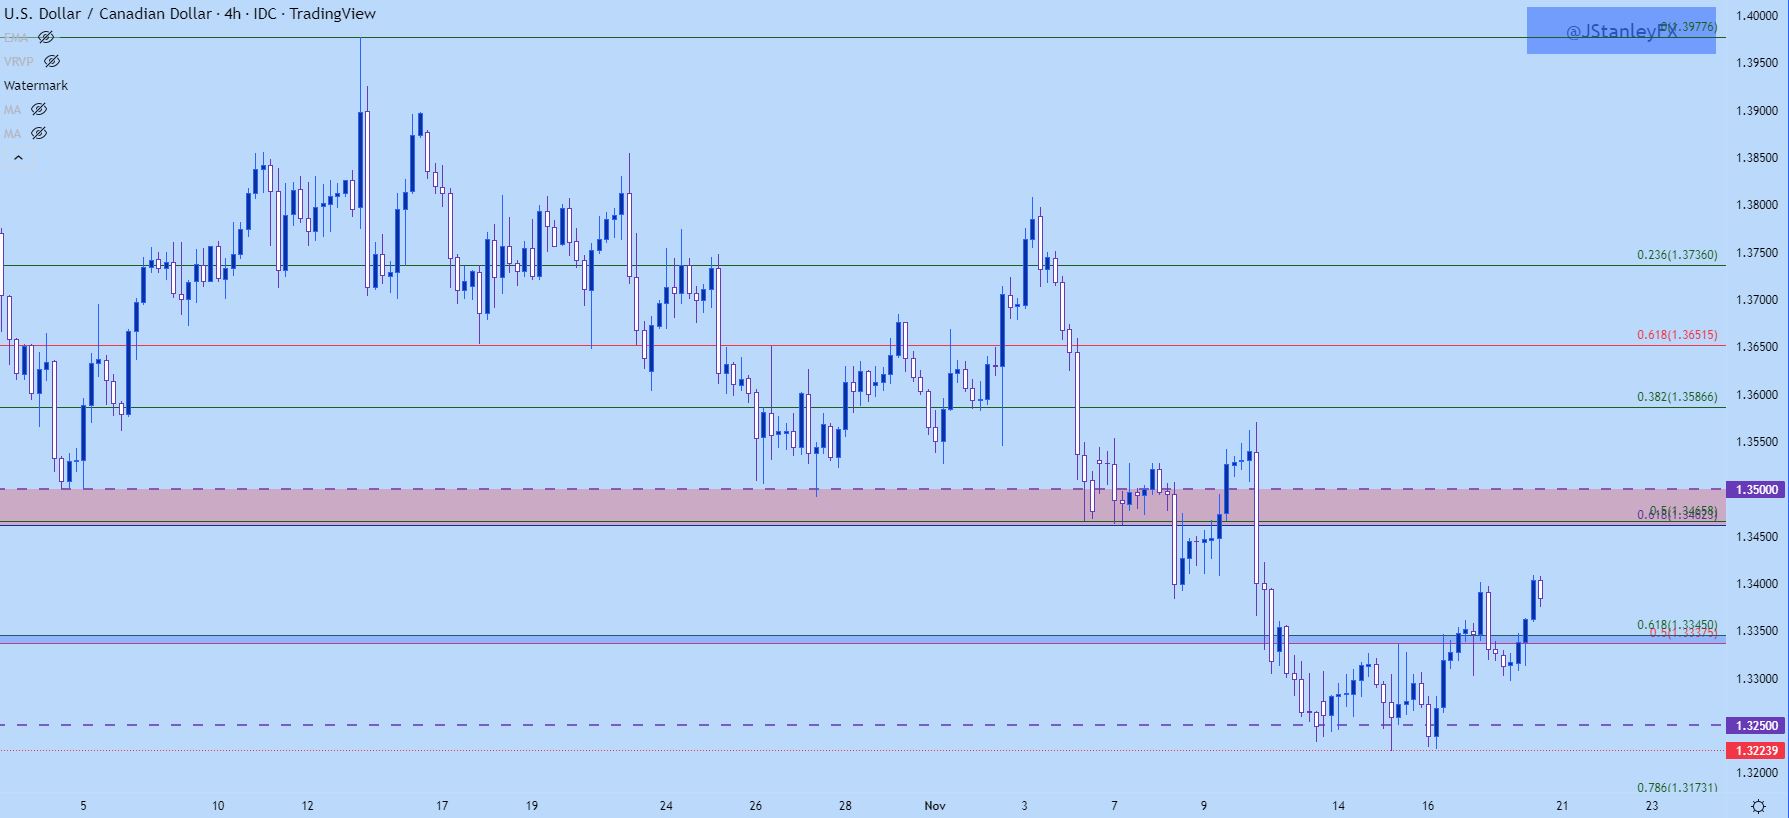
Chart prepared by James Stanley; USDCAD on Tradingview
USD/JPY
In terms of US Dollar recovery, USD/JPY remains of immense interest. When the bullish USD trend was driving-higher USD/JPY was one of the more aggressive pairs on that theme, helped along by a really weak Yen driven by the Bank of Japan’s easy money policies.
But, as looked at on Thursday, when carry trades unwind, the move can be aggressive and given the proximity to rates themes, that’s what’s been happening as the USD sell-off has taken FX markets by hold.
The question is now whether USD/JPY has found that bottom and the short-term setup in USD/JPY is very similar to the DXY setup looked at above. From the below four hour chart, we can see a similar build of short-term resistance around 140.80 that shares a very comparable context to the 107.27 level in DXY.
USD/JPY Four-Hour Chart
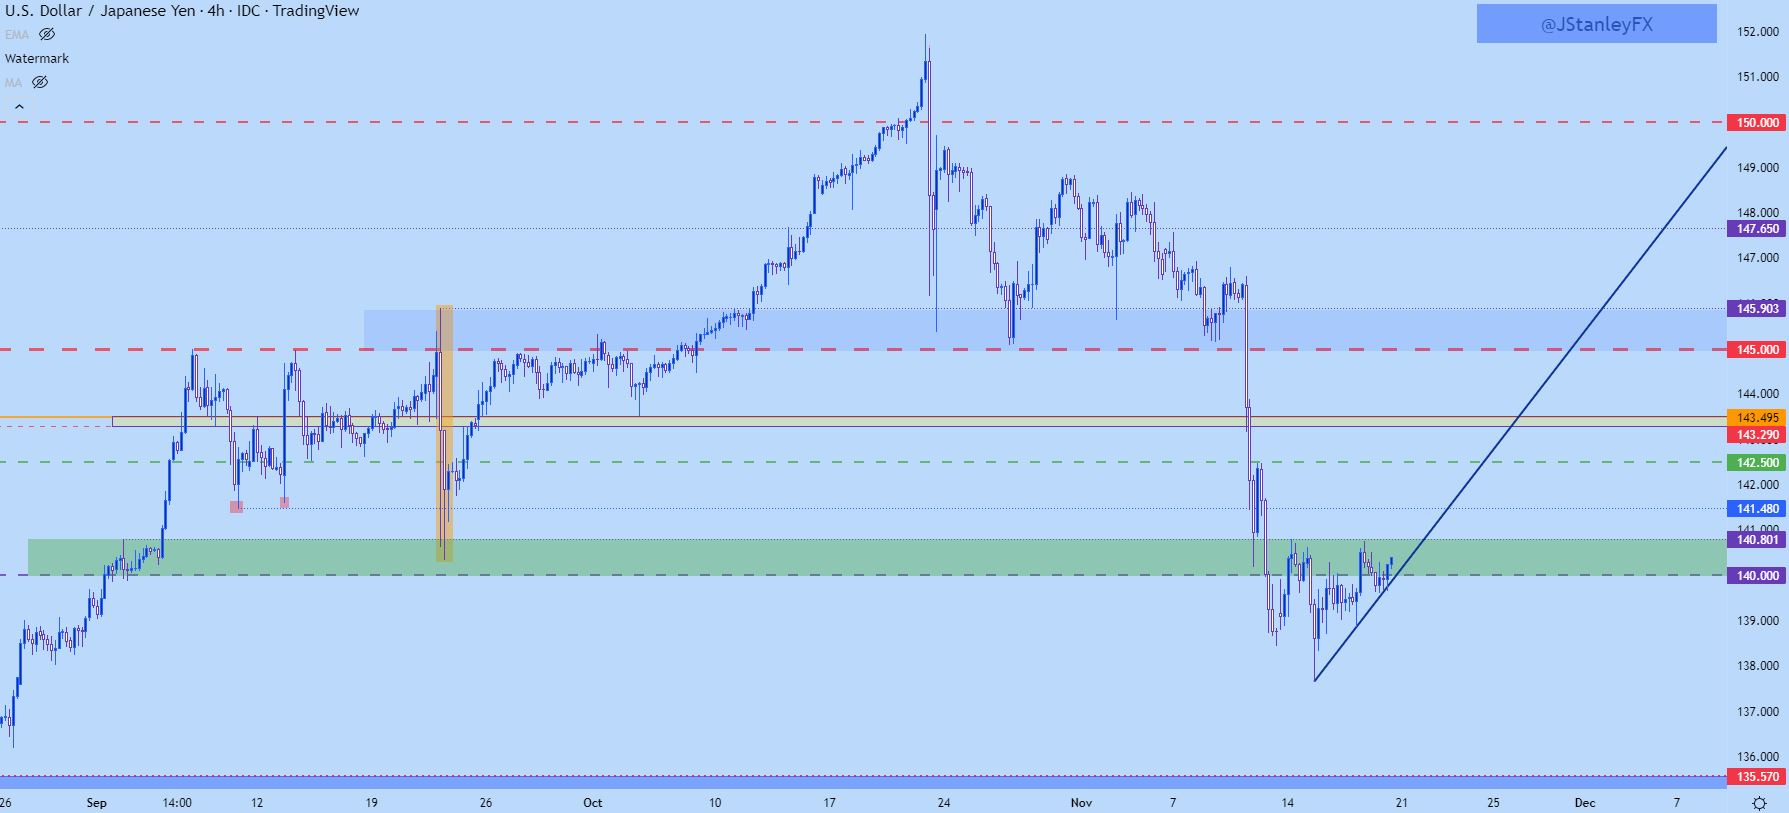
Chart prepared by James Stanley; USDJPY on Tradingview
USD/JPY 140
As I had touched on in the Thursday article, the 140 psychological level appears to be a big deal here for bulls looking to play bounces in the pair. At this stage, price remains as resistance in a zone of prior support. This doesn’t necessarily rule out a bullish scenario, but it does highlight that buyers have some work to do to reverse the recent bearish trend. The next resistance above 140.80 that I’m tracking is around 141.50 which was a prior swing low. After that, 142.50 as a psychological level and 143.50 as a prior price action swing comes into the picture as next resistance.
USD/JPY Daily Price Chart
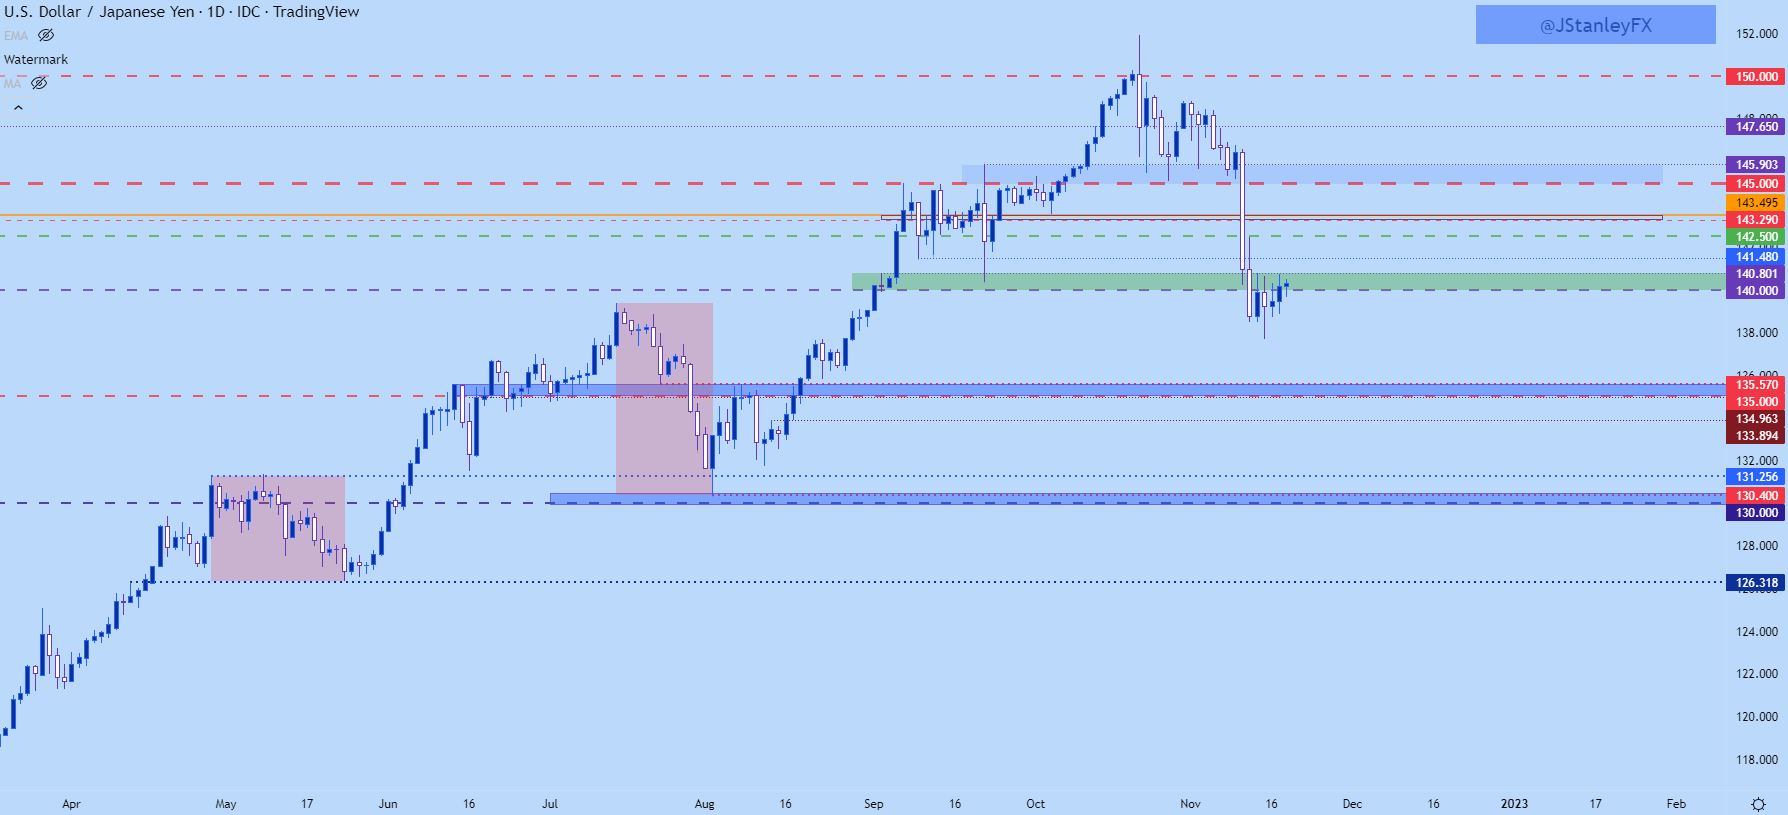
Chart prepared by James Stanley; USDJPY on Tradingview
--- Written by James Stanley, Senior Strategist, DailyFX.com & Head of DailyFX Education
Contact and follow James on Twitter: @JStanleyFX


