


US Dollar talking points:
- It’s been a week of pullbacks in markets as stocks have rallied and the dollar has dropped despite a seemingly negative backdrop of disappointing corporate earnings.
- The big driver is next week’s FOMC rate decision and the Friday morning drivers loom large, as hope is percolating for a softer Fed after next week’s expected 75 bp hike.
- For the USD – before we get to the Fed we have to get through the European Central Bank’s rate decision tomorrow and the big question there is if Lagarde can evoke anything more than a short squeeze in EUR/USD.
- The analysis contained in article relies on price action and chart formations. To learn more about price action or chart patterns, check out our DailyFX Education section.

I had looked into the US Dollar on Monday and I highlighted a counter-trend setup that was brewing and, technically, had already triggered.
The US Dollar set a double top formation after last week’s failure to breakthrough 113.92. That price was the same exact level that turned around the advance a week earlier after another really hot inflation report. The fact that the USD was showing pullback potential despite what appeared to be a seemingly bullish USD backdrop gave the appearance that something else was going on, perhaps sentiment related or potentially from a counter-part. And there does seem to be some remaining hope that there’s a Fed pivot on the way, helped along by last Friday morning’s events that I had discussed in that Monday article.
That Friday push started to trigger the double top on the same day that the second high had set. Prices held the line at a key spot of support that made up the formation’s neckline around 111.74, which itself was a prior point of resistance from an ascending triangle formation that I was working with earlier in the month on the USD. This level had held into Monday trade, at which point a descending triangle had showed, which is a bearish formation that points to possible breakdown potential.
That breakdown started to hit in earnest yesterday with a strong push-lower, finding support at the s1 spot around 110.79. And this morning, even more continuation as price came back to the same zone that was in-play a few weeks ago in early-October, spanning from a mass of confluence from the 110 psychological level up to the 110.25 Fibonacci level.
So far, that’s holding the lows in the USD this morning.
US Dollar Two-Hour Price Chart
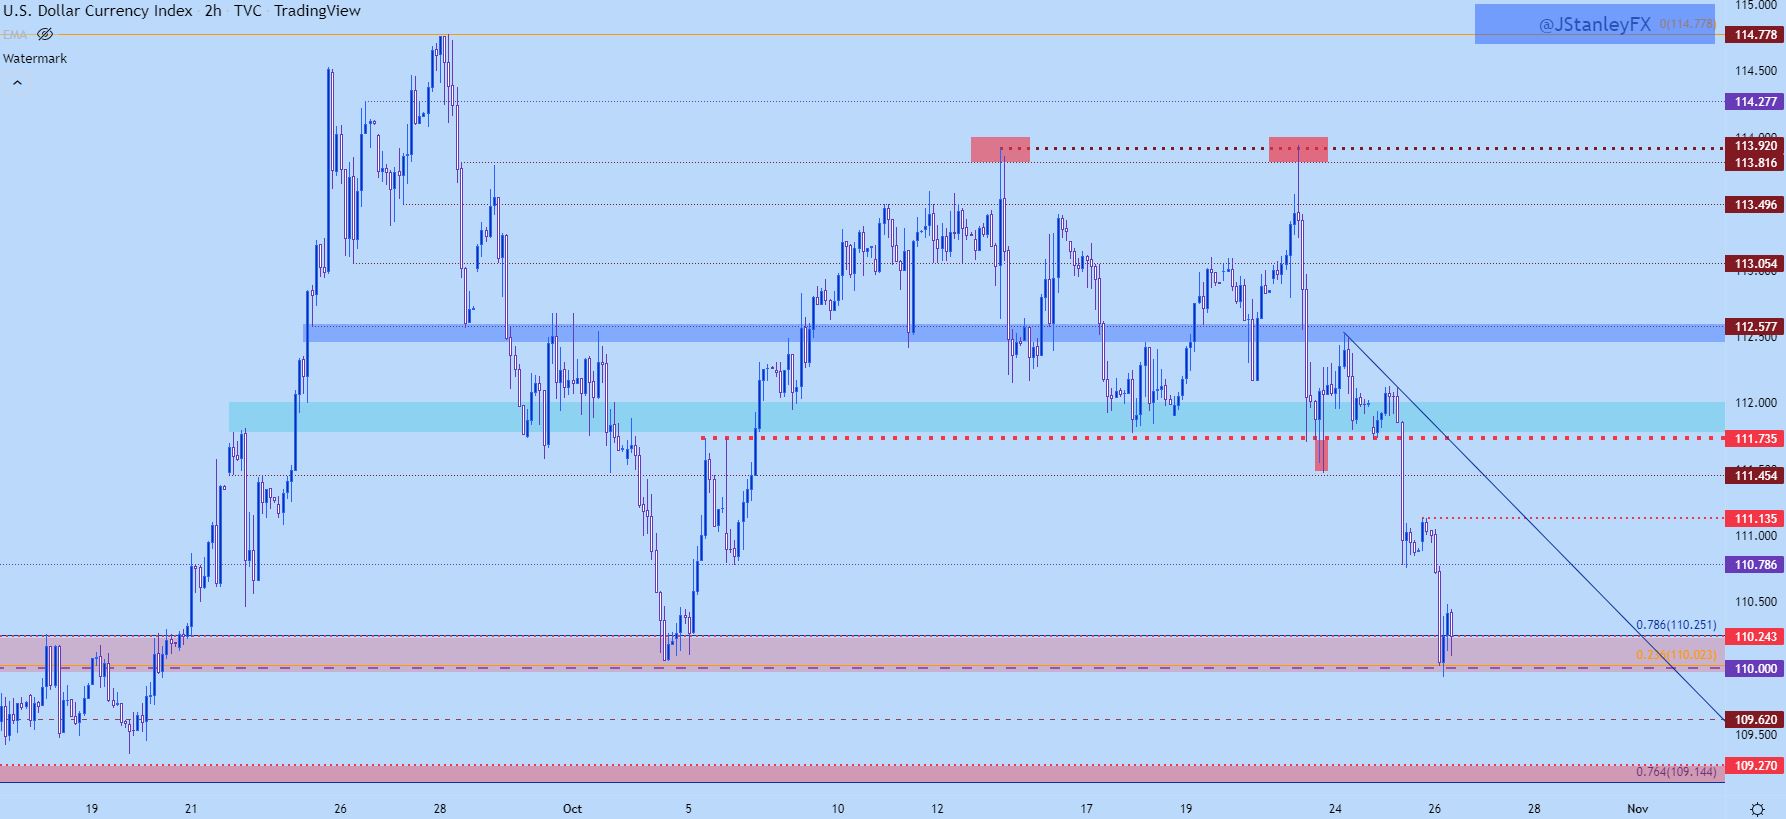
Chart prepared by James Stanley; USD, DXY on Tradingview
Has the US Dollar Topped?
Markets have obsessions with tops and bottoms. As I often share, that’s of less interest to me than price action: Because whether the market has topped or not, we will not know for a fact until it’s too late (and thereby, no longer actionable). I’d much rather put myself in a position to maximize possible opportunities rather than waiting around for weeks to confirm a top or bottom.
But, to put this move in scope, one simply needs to observe the 2022 major move and they’ll notice that this move has been but a 23.6% retracement of this year’s jump. And that retracement level is yet another point of emphasis in this confluent batch of support that sits from the 110 psychological level up to the 110.25 Fibonacci level.
US Dollar Weekly Chart
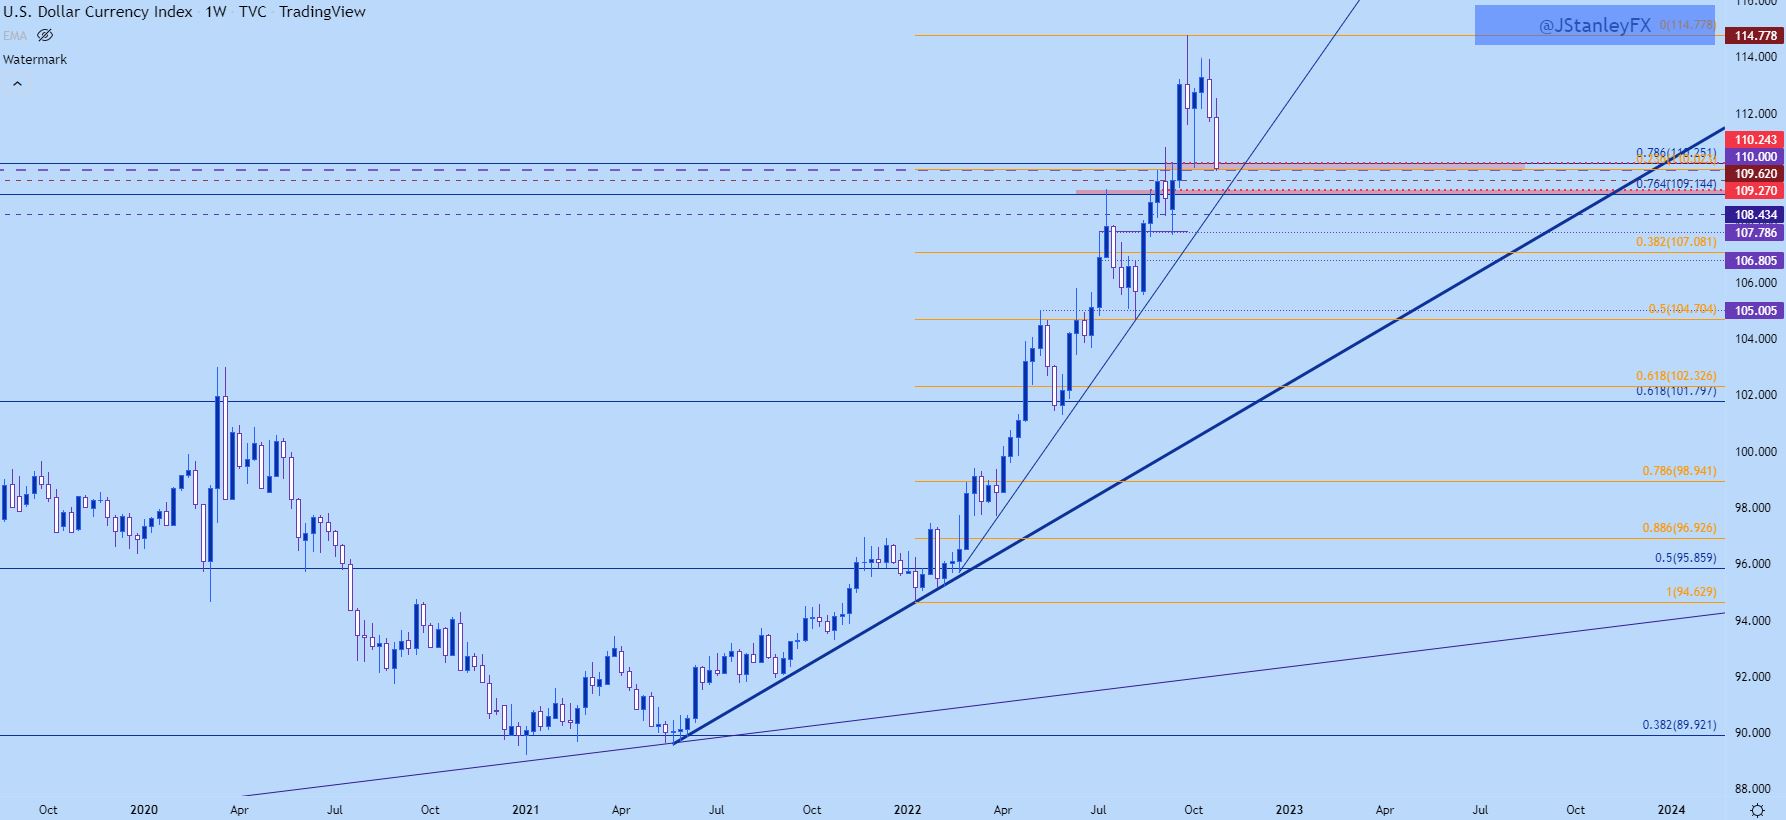
Chart prepared by James Stanley; USD, DXY on Tradingview
Well, We’re Waiting – Has the USD Topped or Not
I’m guessing that it hasn’t but, that’s a guess and I’m going to be direct with you. I don’t know if that’s the high just like nobody else does, and trying to form that guess into a hypothesis places emphasis on the fact that, just a week ago, these trends remained hot in USD. Until that Friday reversal, just ahead of the Fed’s blackout window.
My opinion is that what we’re seeing is sentiment-related after a prolonged topside run in the USD, helped along by the collapse-like move in the British Pound in late-September. GBP plays a large role in DXY so when the pair went into full bear mode, USD rushed higher before pulling back. That’s what created the wide wick on the weekly and monthly charts and if you’re looking at that in a vacuum, sure, there’s symptoms of a top, mainly in the elongated wick sitting atop price action. A very visible reversal is often one of those things that traders can look for to try to find tops, hypothesizing that a pocket of liquidity came into play at a major level that could tilt the flow of the trend. This is where pin bar formations come from, which is what we saw in GBP/USD in late-September around that collapse-like move.
The big test, of course, is the FOMC rate decision next Wednesday: Will the Fed soften their punch? Or, will we see a repeat of Jackson Hole where Jerome Powell comes out to make a statement that inflation hasn’t been tamed and the Fed’s not yet willing to entertain the prospect as the risk of inflation running-higher, even through all of this year’s tightening – is too large to bear.
Before we get there, however, there’s another matter and that’s tomorrow’s ECB rate decision…
For US Dollar technical levels, I’m tracking next support at a zone from 109.14-109.27. And along the way, 109.62 comes into play which as I shared on Monday, is the projection from the double top breakdown.
US Dollar Four-Hour Chart
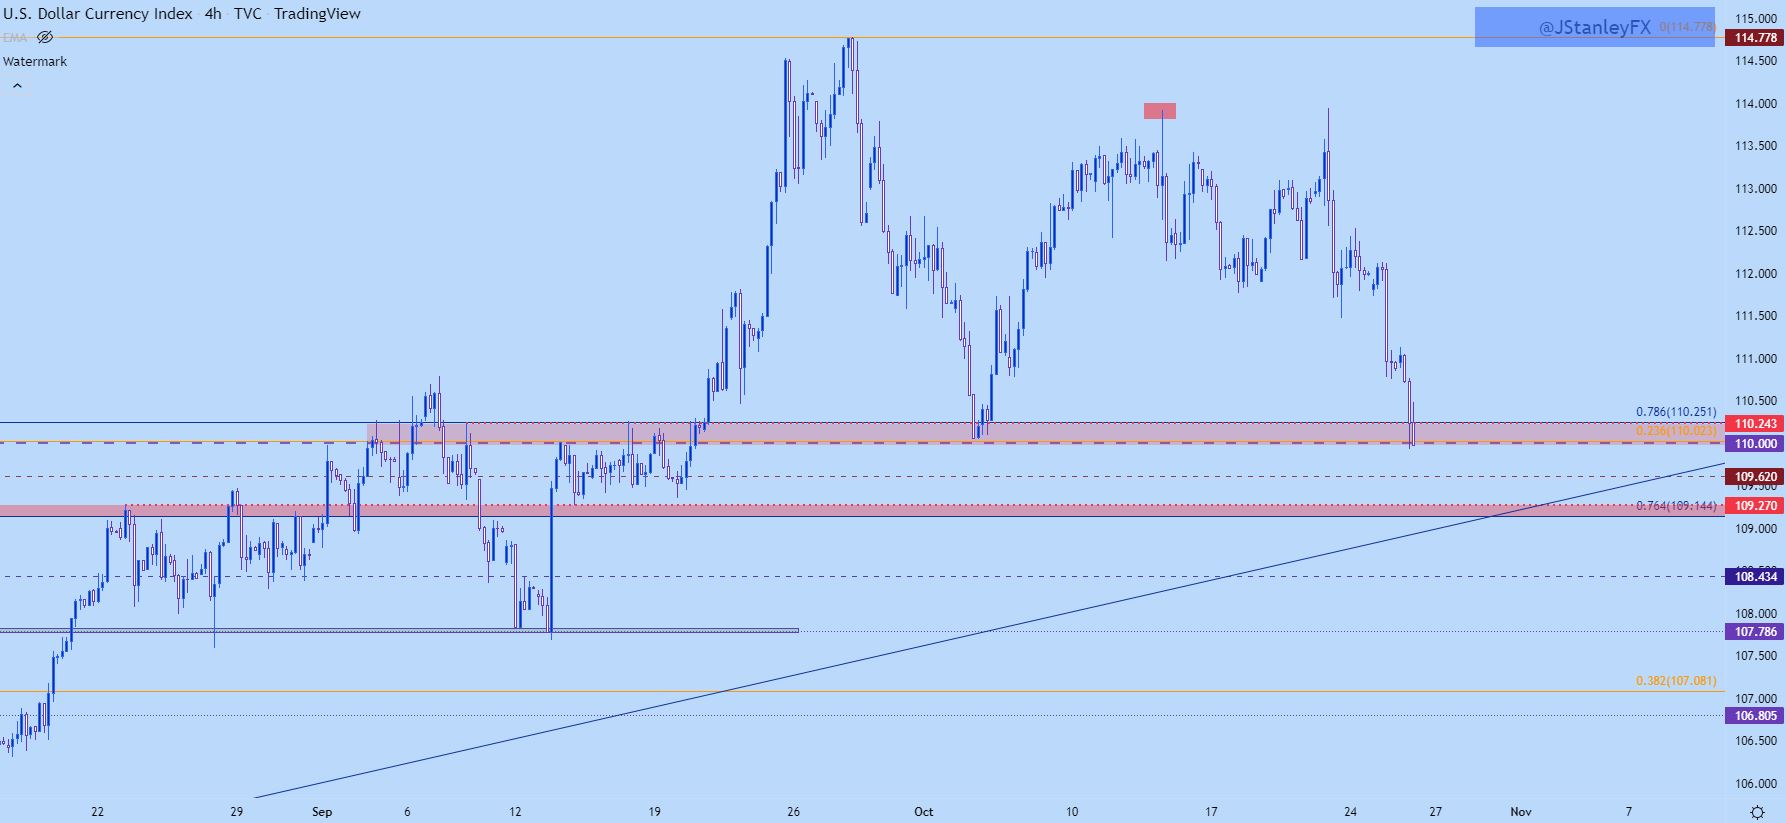
Chart prepared by James Stanley; USD, DXY on Tradingview
EUR/USD
I’ve talked about this a lot this year but the Euro is by far the largest constituent of the DXY index at 57.6%. The rationale is a relic, really, as DXY was created in 1973 in a far different economic backdrop, well ahead of the Euro’s creation. And the index was heavily based on a number of Euro-related currencies like the Deutsche Mark, French Franc, Spanish Peseta, Dutch Guilders, etc. And when the Euro was crated, those allocations were simply amalgamated into one ‘Euro’ allocation.
Is this a good barometer of the USD impact on the global economy today? Probably not, as there’s no China exposure and the role that China plays in global markets has changed dramatically since 1973 but the DXY hasn’t, really.
Nonetheless, this does highlight an item of importance for the US Dollar. The USD is going to have a very difficult time forcing a move in either direction without at least some help from the Euro. This year’s scalding USD bullish trend has been matched by the mirror image in a massive sell-off in the single currency this year. And if we look at interest rates there’s really not much question as to why. But, there’s also been some pretty considerable fear given what’s changed since February.
On the below chart, we can see the bearish trend in EUR/USD taking on a new life after February, which is when Russia invaded Ukraine. This brought war to Europe’s eastern border but perhaps more key for economic implications, it disrupted supply chains and took a way a major asset of cheap energy. This raises question marks about the future, which is reflected in this chart below.
Notice the more aggressive angle on the more recent trendline that originated in February.
EUR/USD Weekly Chart
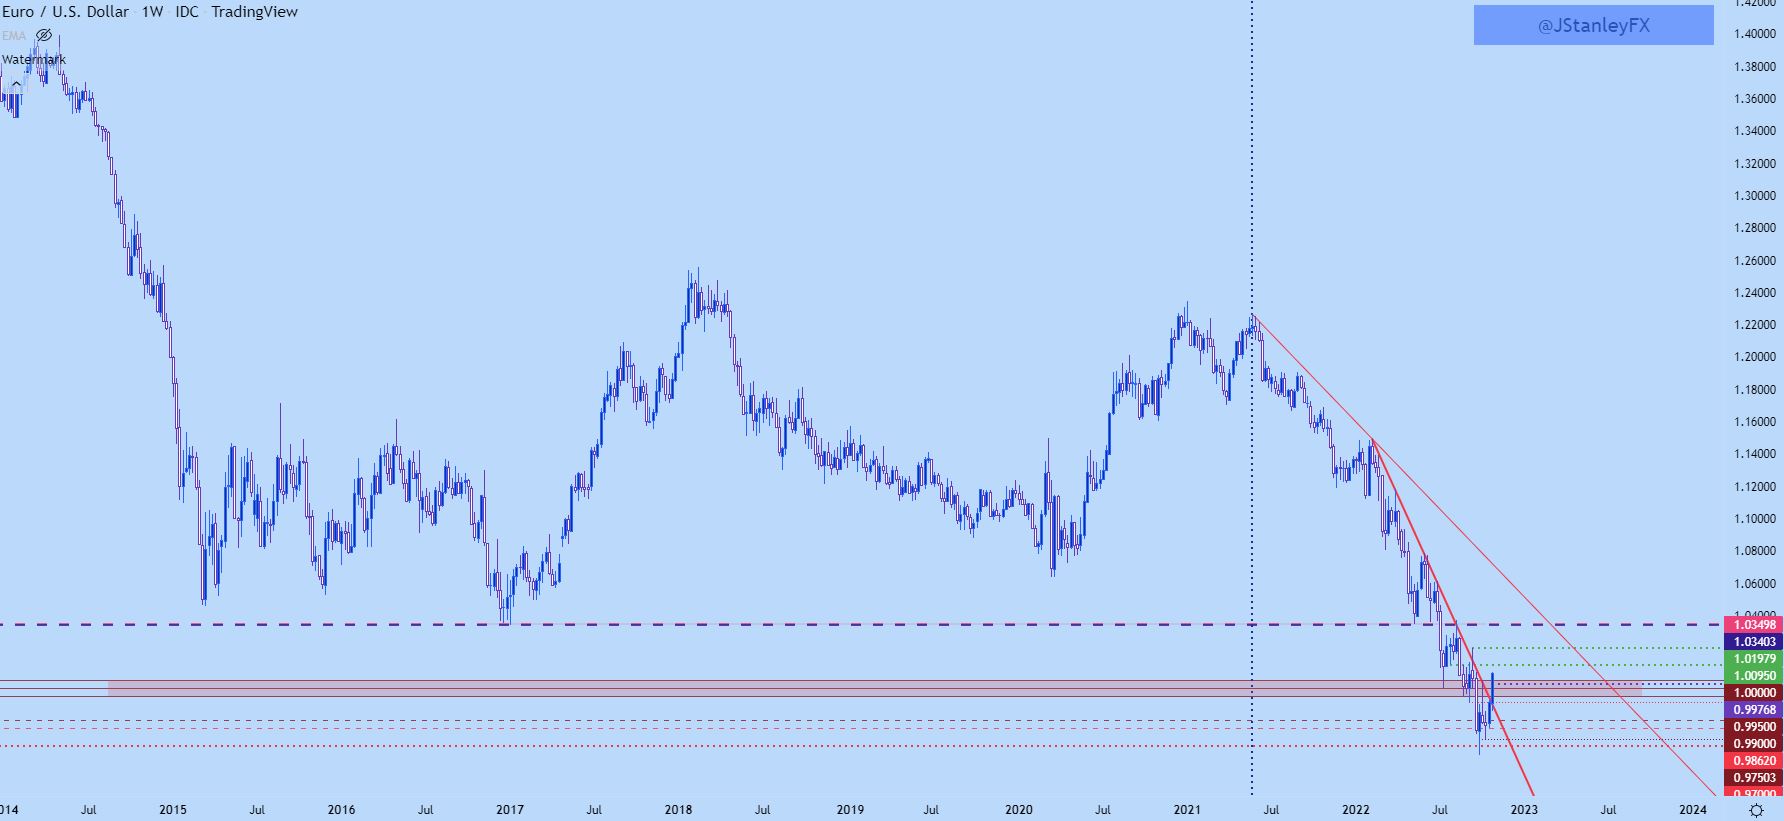
Chart prepared by James Stanley; EURUSD on Tradingview
EUR/USD Short-Term: Rally in Front of ECB
I started looking at pullback potential in the EUR/USD last week, highlighting a series of higher-lows that had started brewing.
And then this week started with a push up to a confluent resistance area at .9900, which is both a psychological level and a trendline projection. As I shared in the Monday call, this gave appearance of a bullish move that had started to brew, and there were two resistance levels sitting overhead at .9950 and 1.0000. I was expecting a batch of stops to be lodged above each, which would act as a propellant if price could break-above as stops on shorts are ‘buy to cover’ which adds demand in the market.
And given the moves over the past two days, where price accelerated through each of those resistance levels, that would appear to be the case.
So, at this point, I’m of the opinion that this is a short squeeze scenario. Those can run for a bit but whether it does or not will be dependent on how hawkish Christine Lagarde can be at tomorrow’s ECB meeting. And a short squeeze can quickly turn into a rally but this would likely need both a much more-hawkish ECB tomorrow and a much more dovish Fed next week; a prospect that I’m considering to be a low probability at this point but, once that I would be remiss to dismiss entirely.
I’m tracking next resistance at 1.0095 and 1.0198, after which a major area comes into play around 1.0350.
EUR/USD Daily Chart
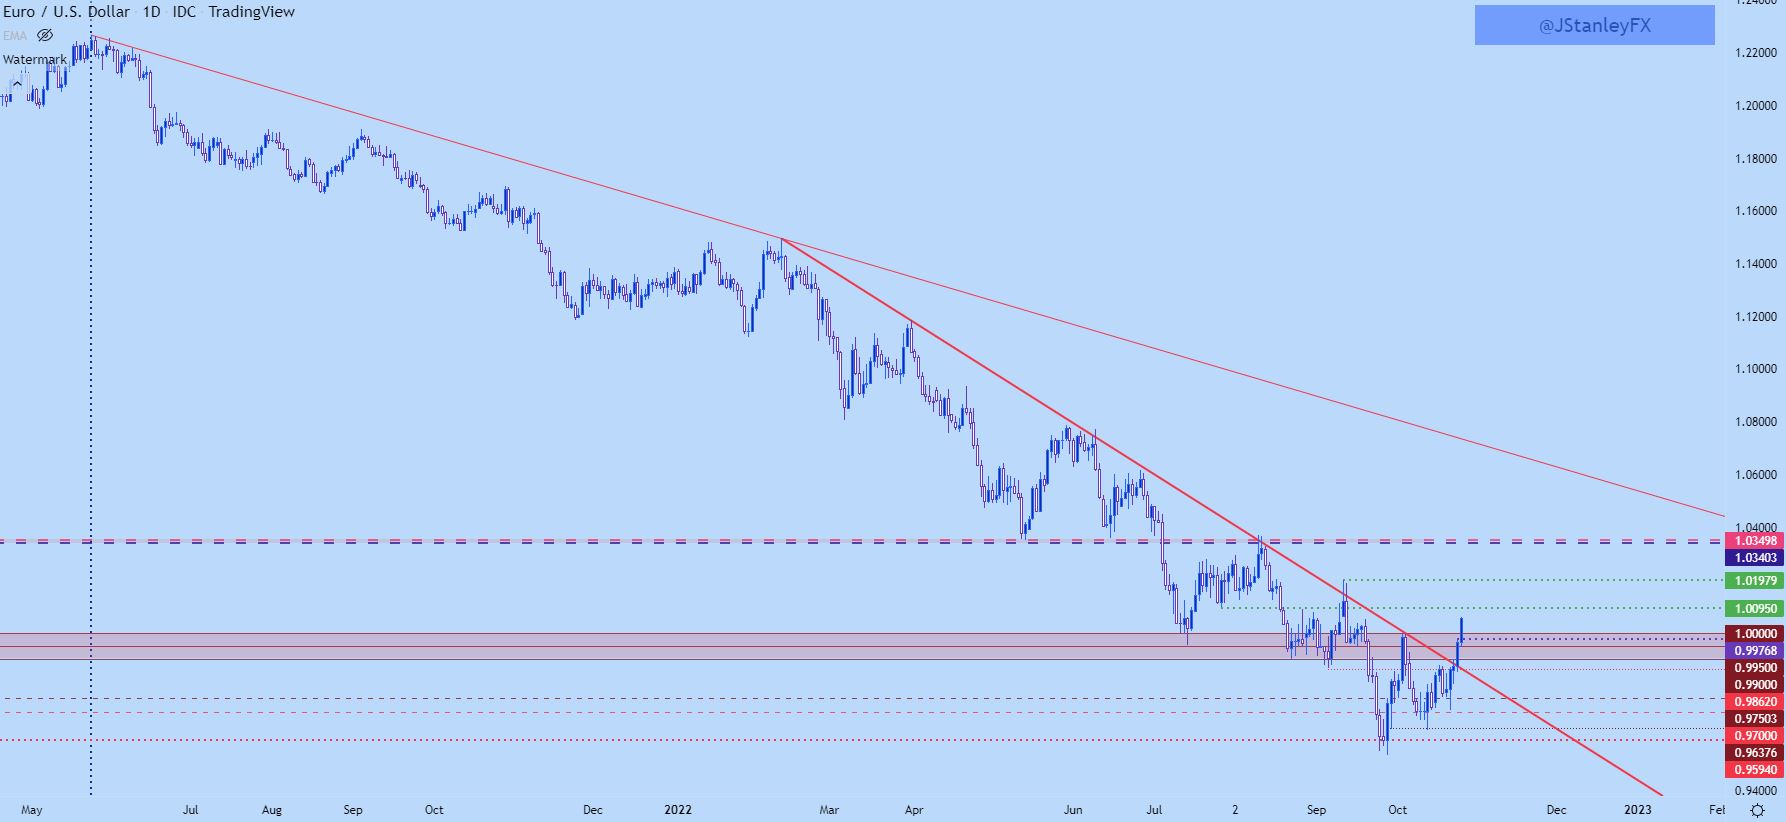
Chart prepared by James Stanley; EURUSD on Tradingview
--- Written by James Stanley, Senior Strategist, DailyFX.com & Head of DailyFX Education
Contact and follow James on Twitter: @JStanleyFX


