


US CPI Inflation Rises Slower than Expected for Headline and Core Measures:
Headline CPI
MoM: 0.1% (Forecast 0.3%, Previous 0.4%)
YoY: 7.1% (Forecast 7.3%, Previous 7.7%)
Core CPI:
MoM: 0.2% (Forecast 0.3%, Previous 0.3%)
YoY: 6.0% (Forecast 6.1%, Previous 6.3%)

Customize and filter live economic data via our DailyFX economic calendar
Immediate Reaction Observed in Selected Markets
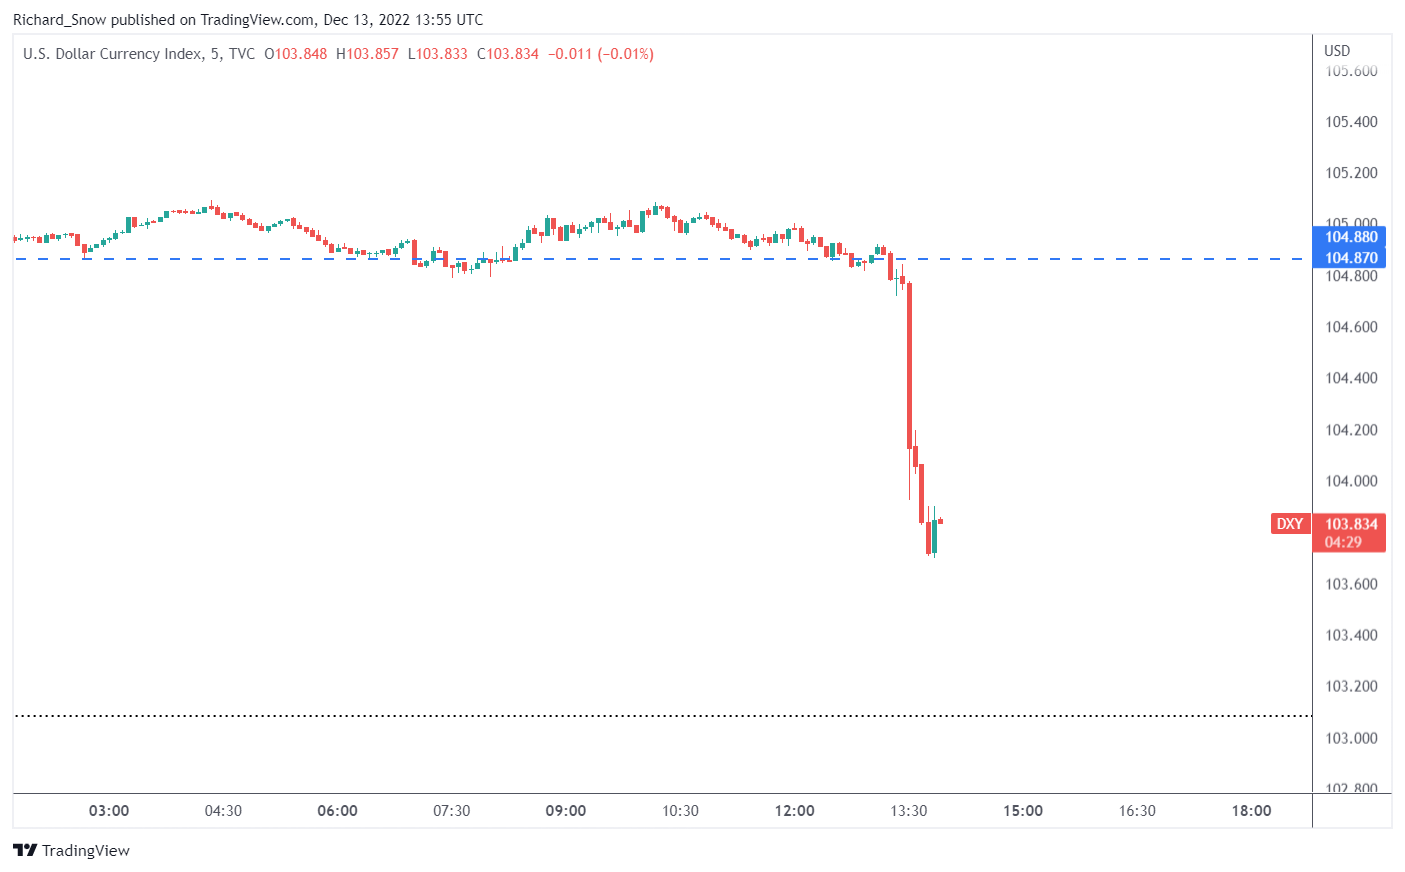
US Dollar Index (DXY)
The dollar index dropped over 1% in the moments following the encouraging CPI data. The dollar therefore, continues its selloff with renewed momentum after the prior cooler CPI print for October
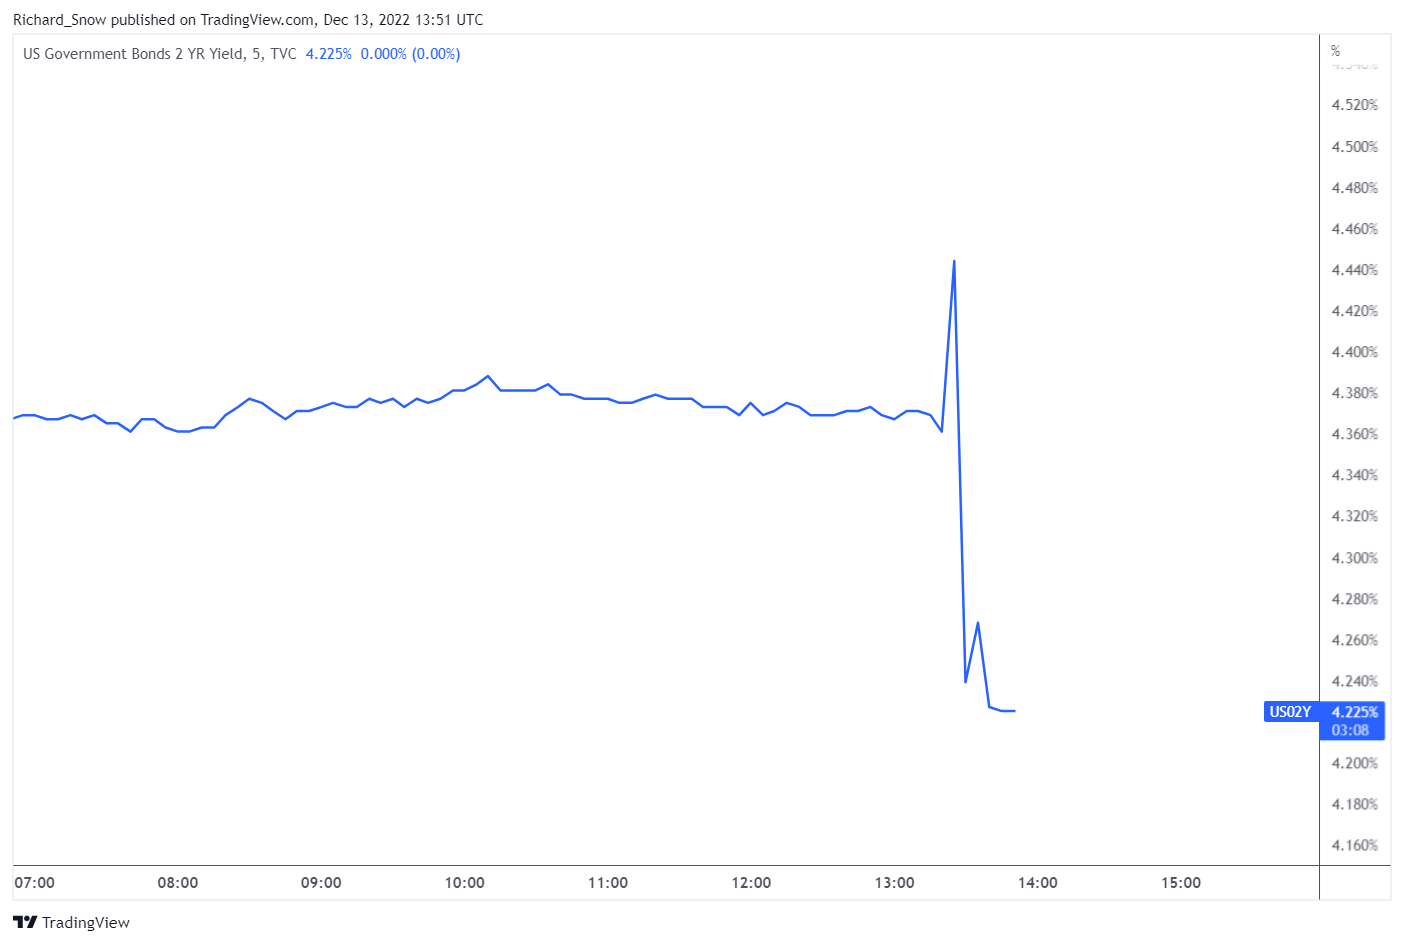
US 2 Year Treasury Yield
The 2 year US Treasury yield dipped as traders revise their stance on the path of future rate hikes lower. Already, the probability of a 25 basis point hike after tomorrows anticipated 50 bps hike is gaining traction and markets revise their estimation of the terminal rate closer to 4.8% via implied probabilities on Fed funds futures.
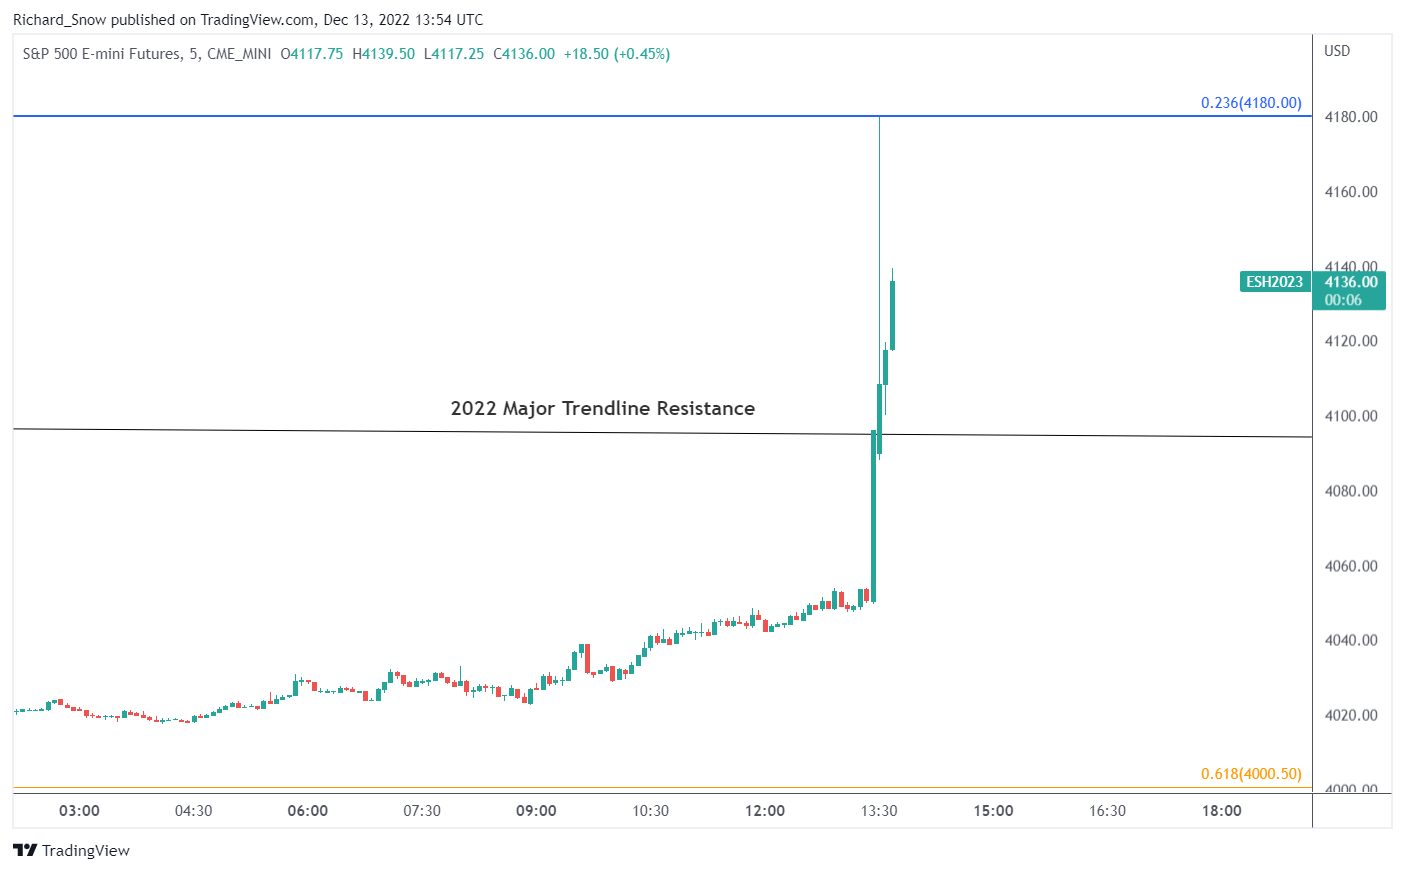
S&P 500 E-Mini Futures
US equity (S&P 500) futures rose above the previously unbreeched long term trendline resistance that has held throughout most of this year. Equity market participants perceive the slower rising inflation as a sign that the Fed pause and inevitable pivot may come to fruition sooner than expected. Risk assets like the S&P 500 has produced long-lasting counter-trend moves at different stages this year but only now has price action pierced above the long-term trendline acting as resistance. The latest move brings into question whether the 'bear market rally' now has a launchpad for a possible trend reversal.
Just How Impactful Have Inflation Prints Been on Financial Markets?
The S&P 500 E-Mini Futures chart shows how influential inflation prints have been in determining not only market direction but also subsequent momentum. On the 13th of September when markets had anticipated a softer CPI print for August, we witnessed an immediate drop (-16% in total) when the 0.2% upside surprise materialized. Then on the 10th of November, the October CPI data produced the cooler inflation print which bolstered riskier markets in the anticipation that the Fed may be forced to tighten less hastily as inflation shows signs of slowing. The index rose nearly 10% off the back of the softer CPI print.
S&P 500 E-Mini Futures Daily Chart
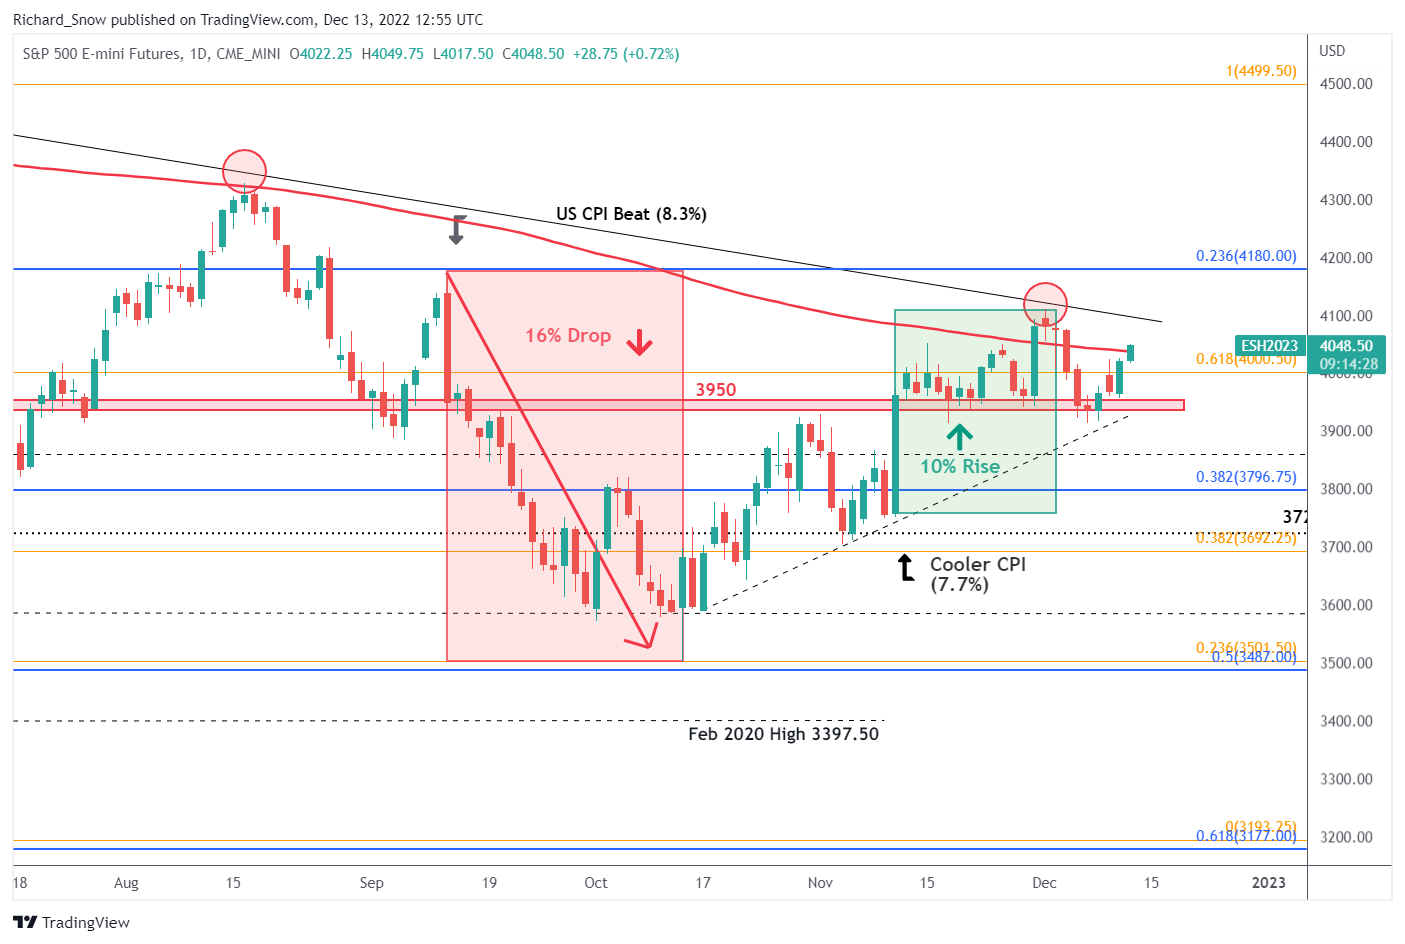
Source: TradingView, prepared by Richard Snow
As one would expect, the dollar too witnessed significant moves on the back of recent inflation prints (CPI and the Fed’s preferred measure of inflation ‘PCE’). As expected, the hotter than expected print in September drove the dollar with renewed vigor as markets priced in further aggressive rate hikes. The most recent October CPI print of 7.7% has set the tone for the latest dollar selloff ahead of the CPI data.
US Dollar Index (DXY) Daily Chart
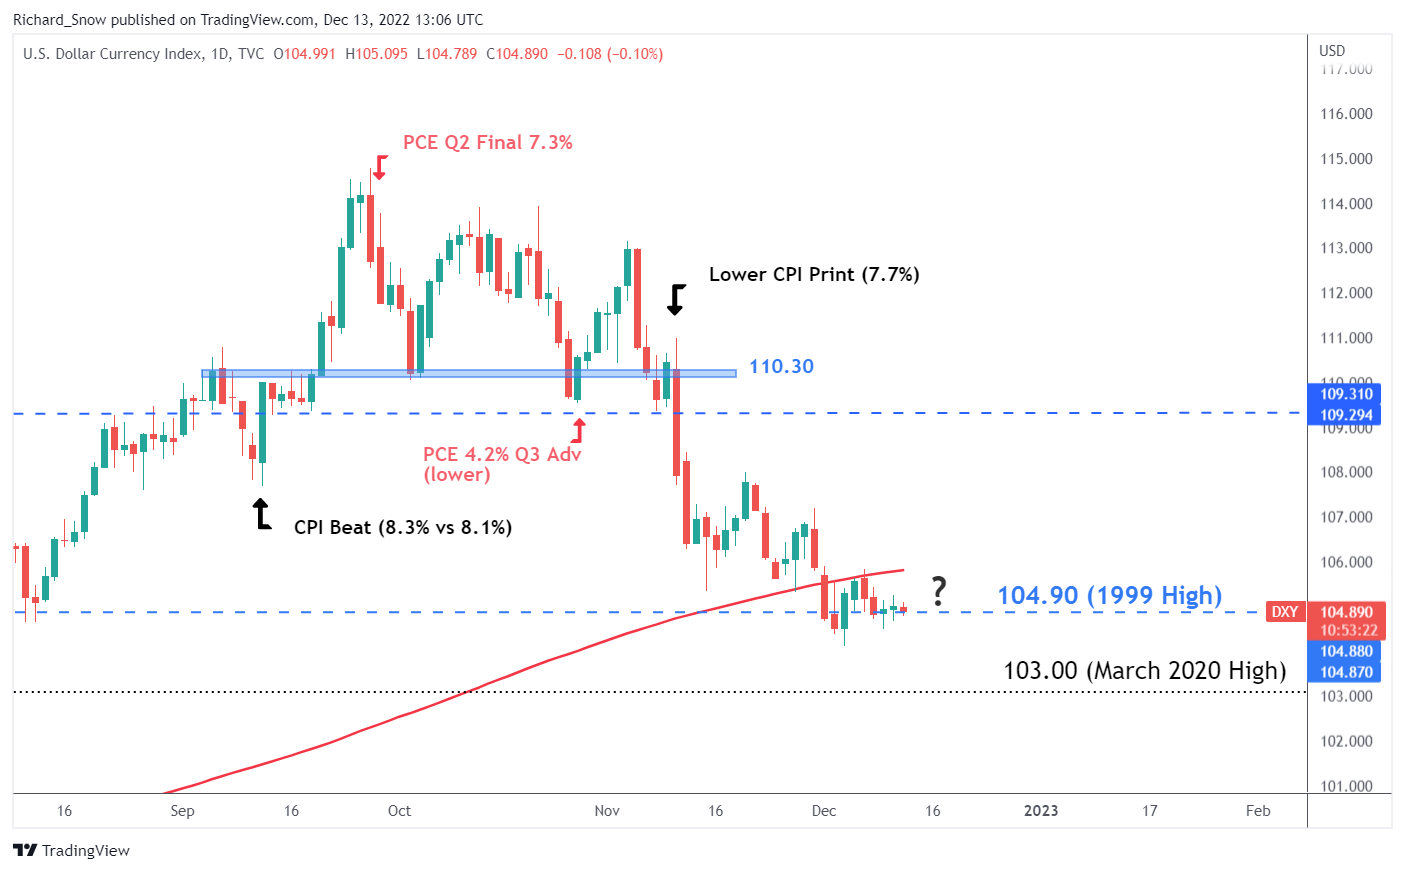
Source: TradingView, prepared by Richard Snow
--- Written by Richard Snow for DailyFX.com
Contact and follow Richard on Twitter: @RichardSnowFX


