
The Hang Seng Index (HSI) is the main stock market benchmark of Hong Kong. It is one of the most liquid and widely traded stock indices in the Asia-Pacific region.
WHAT IS HANG SENG INDEX – AN INTRODUCTION
The Hang Seng Index (HSI) was introduced in November 1969 and has become the most quoted indicator tracking the performance of the Hong Kong stock market. The HSI is a freefloat-adjusted, market capitalization-weighted benchmark, containing 52 constituents that represent about 50% of the capitalization of the Hong Kong Stock Exchange (HKEX). There is a 10% weight cap for each of the index’s constituents to avoid single stock domination. The HSI is quoted and traded in terms of the Hong Kong Dollar (HKD), which is in turn pegged to the USDollar.
Hong Kong has Asia’s third-largest stock market after mainland China and Japan, with a total market capitalization of US$ 6,704 billion as at January 11th 2021. This is around 6.3% of world’s total market capitalization and more than 15 times the value of Singapore’s stock market.
| Market Cap in Billions (USD) | % of Share of World Total | |
|---|---|---|
| World Total Exchange Market Cap | $ 105,959.9 | 100.0% |
| US Exchange Market Cap | $ 43,825.6 | 41.4% |
| China Exchange Market Cap | $ 11,175.5 | 10.5% |
| Japan Exchange Market Cap | $ 6,915.2 | 6.5% |
| Hong Kong Exchange Market Cap | $ 6,703.9 | 6.3% |
| UK Exchange Market Cap | $ 3,399.9 | 3.2% |
| Australia Exchange Market Cap | $ 1,686.2 | 1.6% |
| Singapore Exchange Market Cap | $ 465.2 | 0.4% |
Source: Bloomberg, DailyFX as at January 2021
A DEEPER DIVE INTO INDEX CONSTITUENTS AND WEIGHT
The Hang Seng Index has 52 constituents as of January 2021. The Hong Kong Exchange (HKEX) is planning to increase the number of constituents to 80 following a wave of technology IPOs and “return-home” listings by Chinese firms amid heightened tensions between Washington and Beijing. This came against the backdrop of the US-China trade war and the follow-on disputes over technology, intellectual property and national security ongoing since 2018.
HSI added more technology companies in 2020, including e-commerce giant Alibaba, hardware maker Xiaomi and biotech firm Wuxi Biologics to replace some of the traditional counters.
The benchmark has four sub-indexes: finance, utilities, properties and commerce & industry. The commerce & industry portion accounts for 47% of Hang Seng’s total weight, containing highly valued technology names including Tencent, Alibaba, Xiaomi and Meituan. The finance sub-index is the second-largest category, contributing to 43% of the index’s total weight. It includes big banks such as HSBC, CCB, ICBC and insurance companies namely AIA and Ping An.
Properties and utilities sub-indexes account for the remaining 10% of HSI, reflecting the shrinking share of traditional industries in the basket over recent years.
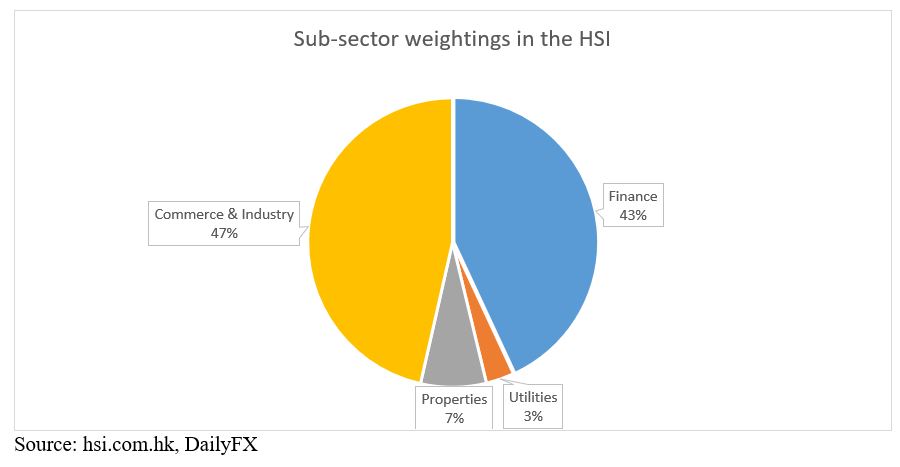
Source: hsi.com.hk, DailyFX
Hang Seng Index constituents can be further divided into sub-industries, as illustrated in the chart below. Financials (42.3%), information technology (23.7%) and consumer discretionary (8.04%) together account for nearly three quarters of Hang Seng’s weight, while these three sectors contain only 22 out of 52 constituents. This suggests that the index is highly concentrated towards a handful of large-cap stocks, which tend to have a significant influence on its daily performance.
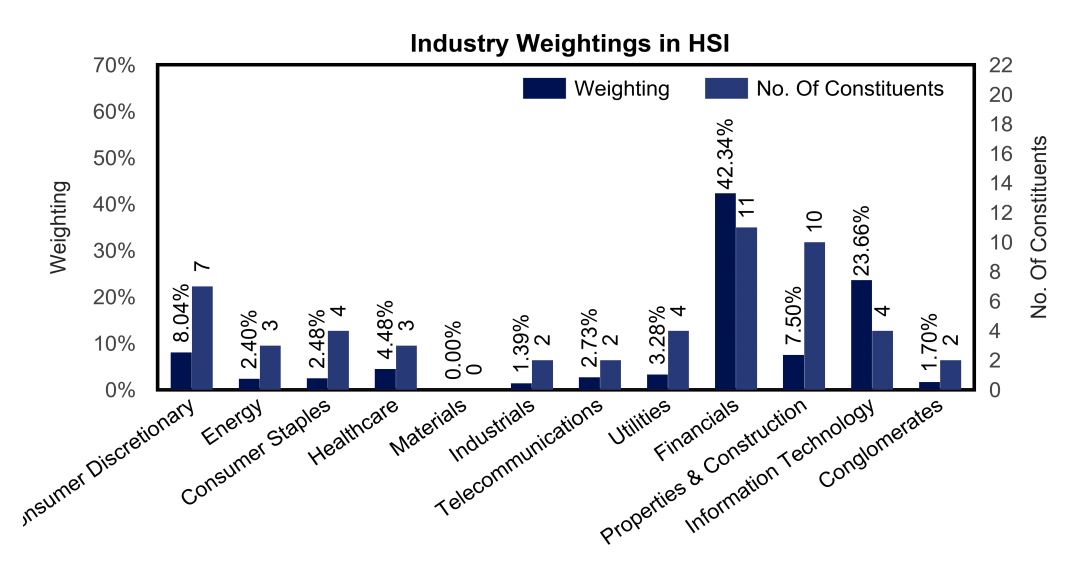
Source: hsi.com.hk
As for individual components, AIA (10.94%), Tencent (9.60%) and HSBC (7.86%) are the top three constituents in terms of their index weight. The top 10 constituents represent 61% of the index’s value, which again reflects concentration towards several big financial and technology firms.
More than half Hang Seng’s constituent companies are domiciled in mainland China. Seven out of the top 10 index constituents are Chinese firms. Therefore, the index tends to be less sensitive todomestic Hong Kong news-flow than it is to Chinese economic data, the path of the Renminbi (which Chinese companies’ intrinsic value is denominated in) and changes in the political climate across the Pacific Ocean.
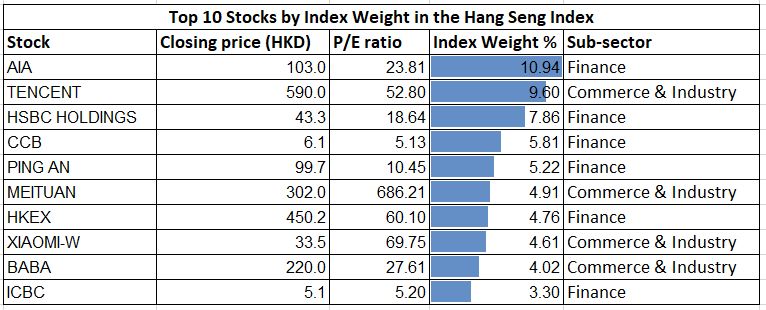
Source: hsi.com.hk, DailyFX as at January 2021
WHAT MOVES THE HANG SENG INDEX?
As a leading stock benchmark in Asia, the Hang Seng Index tends to react to both the overnight lead from Wall Street and events taking place during Asia-Pacific trading hours. It is worth noting that the Hong Kong-Shanghai and Hong Kong-Shenzhenstock connectionsare having a growing impact on HSI's daily performance. The index tends to move in tandem with the Shanghai Composite as some of itsconstituents are dual-listedon themainland. Here are several key aspects to monitor when trading the HSI:
- STOCK CONNECT
Shanghai-Hong Kong Stock Connect and the Shenzhen-Hong Kong Stock Connect are cross-boundary investment channels that connect the Hong Kong Stock Exchange with mainland bourses. The program was launched in November 2014 and has since allowed mainland investors to purchase eligible stocks listed in Hong Kong. It also provides a channel for foreign investors to gain exposure to mainland A-shares. South-bound flows account for close to 8-10% of the total daily trading volume of the Hong Kong Exchange at the end of 2020. All of the Hang Seng Index constituents are eligible for the stock connection.
Traders may monitor daily south-bound turnover for clues about mainland investors’ risk appetite. When south-bound buy volume far exceeds sell volume, this could hint at rising risk appetite, with net inflows buoying HSI. In the same way, a large net outflow via the stock connection may undermine the index.
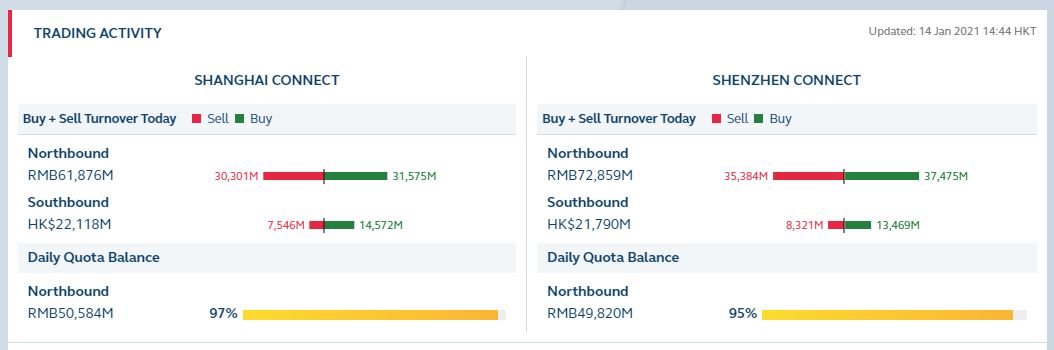
Source: hkex
- US-China Relationship, Political climate
The political climate surrounding the world’s two largest economies tends to have a significant impact on the Hang Seng Index. When the Trump administration in Washington ignited a trade war with Beijing in 2018, HSI fell as much as 22% from June to October amid a deteriorating US-China relationship and concerns about the follow-on impact of the rift on the global economy.
Since then, many of Hang Seng’s top constituents – such as Alibaba, Tencent and Xiaomi – have faced increased scrutiny from US regulators as disputes between Washington and Beijing escalated into the technology space. In early January 2021, three Chinese telco firms – China Mobile, China Telecom and China Unicom – saw their shares fall sharply in Hong Kong after the NYSE banned their US listings under Executive Order 13959, citing alleged ties to the Chinese military.
Therefore, traders should keep a close eye on the US-China relationship and the latest developments in US foreign policy to assess the potential impact on HSI. In a nutshell, a worsening US-China relationship tends to encourage capital outflow and exert downward pressure on the index, whereas warming relations may serve as a positive price catalyst. Explore our educational resources on global macro analysis where we introduce a proprietary model for following global economic relationships.
- STRENGTH OF THE HK DOLLAR (USD/HKD WEAKNESS)
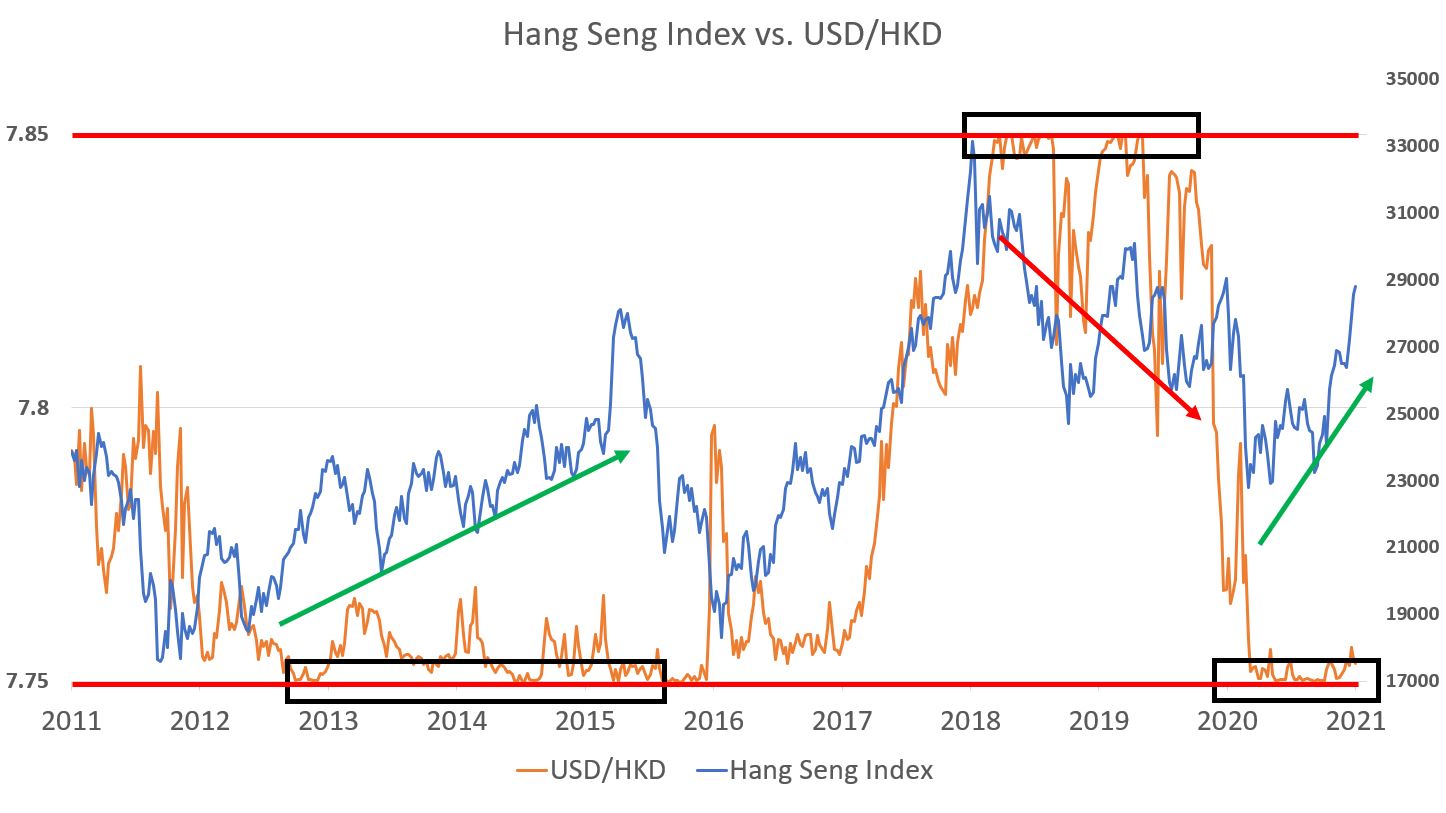
Interestingly, the strength of the Hong Kong Dollar (HKD) is sometimes used as a reference for capital flows and may serve as a trading indicator. The currency is pegged to the US Dollar within a narrow trading range of 7.75-7.85 since May 2005. When USD/HKD is trading above 7.85, the Hong Kong Monetary Authority (HKMA) will sell the US Dollar and purchase HKD in the market to bring the exchange rate back into the target band. Alternatively, when USD/HKD is trading below 7.75, the HKMA will sell the HKD and purchase the US Dollar toward the same end.
When USD/HKD is trading closer to the ceiling at 7.85, this reflects strong selling pressure on HKD and may be perceived as an indicator of capital outflows. At such times, the stock market may underperform. For example, USD/HKD was mostly trading at or near range top at 7.85 in 2018-2019 (chart below). The Hang Seng Index suffered significant losses during this period as capital fled from the Hong Kong stock market. On the flip side, when USD/HKD is trading closer to the lower bound of 7.75, like during 2013-2015 for example, this may indicate that strong capital inflows are underpinning HSI gains as HKD demand swells.
Source: Bloomberg, DailyFX
- ECONOMIC EVENTS
Macroeconomic data is an important barometer to assess the health of the underlying economy. Key statistics to watch include China’s GDP growth, trade balance, manufacturing PMIs, industrial production, retail sales, and inflation. Local Hong Kong data tends to have a smaller impact on the benchmark index. A timely, detailed view of relevant upcoming and past events can be found on the DailyFX economic calendar.
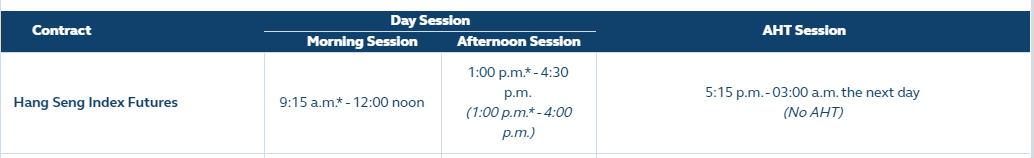
Hang Seng Index Trading Hours
Hang Seng Index (HSI) futures can be traded on the Hong Kong Exchange (HKEX) from Monday to Friday, 9:15am to 12:00 noon (morning session) and 1:00pm to 4:30pm (afternoon session) local Hong Kong time. After-hour trading (AHT) starts from 5:15pm and lasts until 3:00am on the next day.
In the event of extreme weather conditions like a typhoon signal or black rainstorm warning, trading may be delayed or cancelled for that day. Traders may monitor news and messages disseminated through HKEX’s market systems on the impact of severe weather on trading.
Source: hkex
USEFUL TIPS FOR TRADING HANG SENG
It is always important to have a clear plan and do the necessary homework before entering a trade. Successful traders often seek to understand the index’s underlying constituent dynamics, study the fundamental metrics and then apply technical analysis on the price chart to identify entry and exit levels. Critically, risk management is crucial to long-term profitability. Most traders see it prudent to use a stop-loss to mitigate risk.
There is a multitude of strategies to choose from that may offer a good fit for a trader’s risk appetite, timeframe, psychology and other preferences. Here is an illustration of some commonly used technical analysis tools for trading the HSI:
- Identify a trend: up trend, down trend, or no trend
- Traders may prefer to ride a trend rather than pick at swings within tight range-bound markets because the risk-to-reward parameters appear to be more attractive. Tools to identify a trend may include Simple Moving Average (SMA) lines and Bollinger Bands (chart below).
- Simple Moving Averages (SMAs), Bollinger Bands
- Simple Moving Average (SMA) lines calculate the average of the closing price for a selected trading period, like 20 or 50 days for example. In an uptrend, SMA lines tend to be sloped upwards and move higher, with the shorter-term SMAs (like a 20-day) outpacing the longer-term SMAs (like a 50-day). The reverse is true for a downtrend.
- In an uptrend, theHang Seng Index may trade within the upper half of the Bollinger Band indicator. A flip below the middle Bollinger Band line – which is a moving average – into the lower half may signal a potential trend reversal lower.
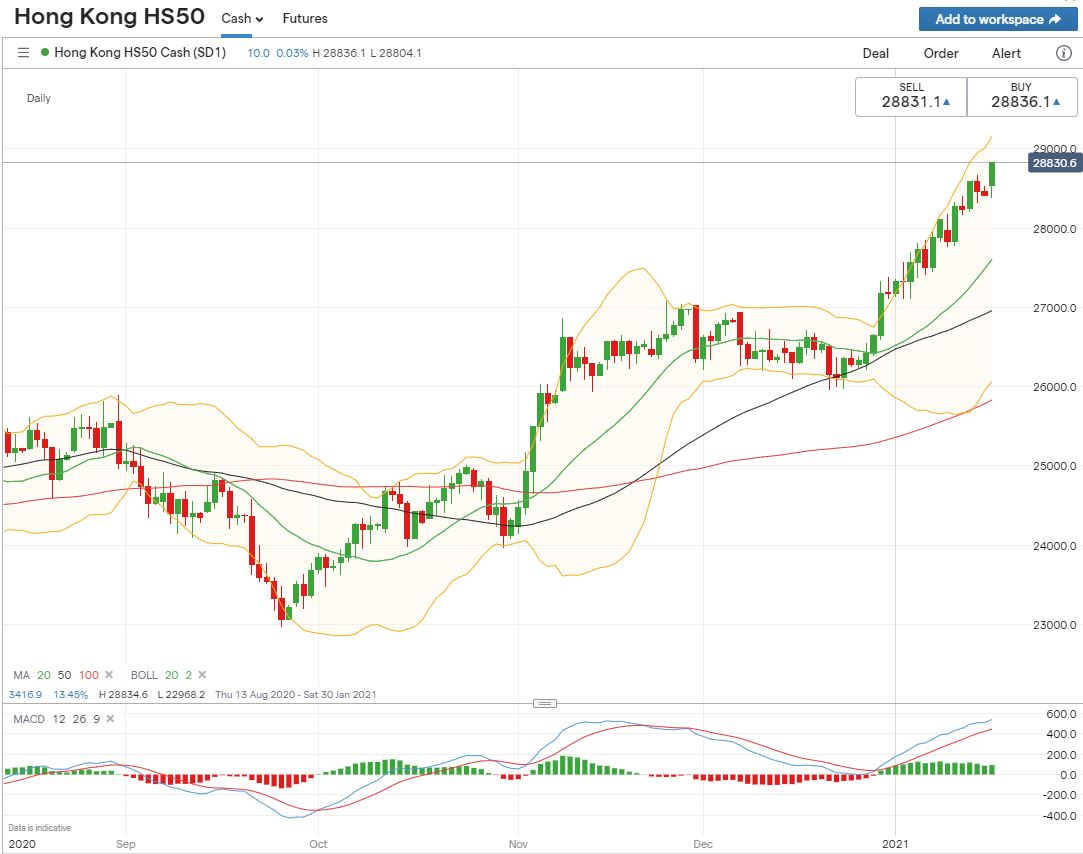
Chart by IG
- Fibonacci Extension: forecasting higher highs, or lower lows
- Fibonacci extension is a sophisticated technical analysis technique that can be used to forecast potential higher highs in an uptrend, or lower lows in a downtrend. Key Fibonacci extension levels include 61.8%, 100%, 161.8% and 200%, which may be used to establish profit-taking levels.
- For example, an upward Fibonacci Extension is drawn on the Hang Seng Index daily chart below. Immediate resistance levels can be found at 29,038 (the 100% Fibonacci extension), followed by 29,877 (127.2% extension) and then 30,944 (161.8% extension). A failed attempt to breach above key Fibonacci levels may lead to a period of consolidation or a deeper pullback to the next lower level for support.
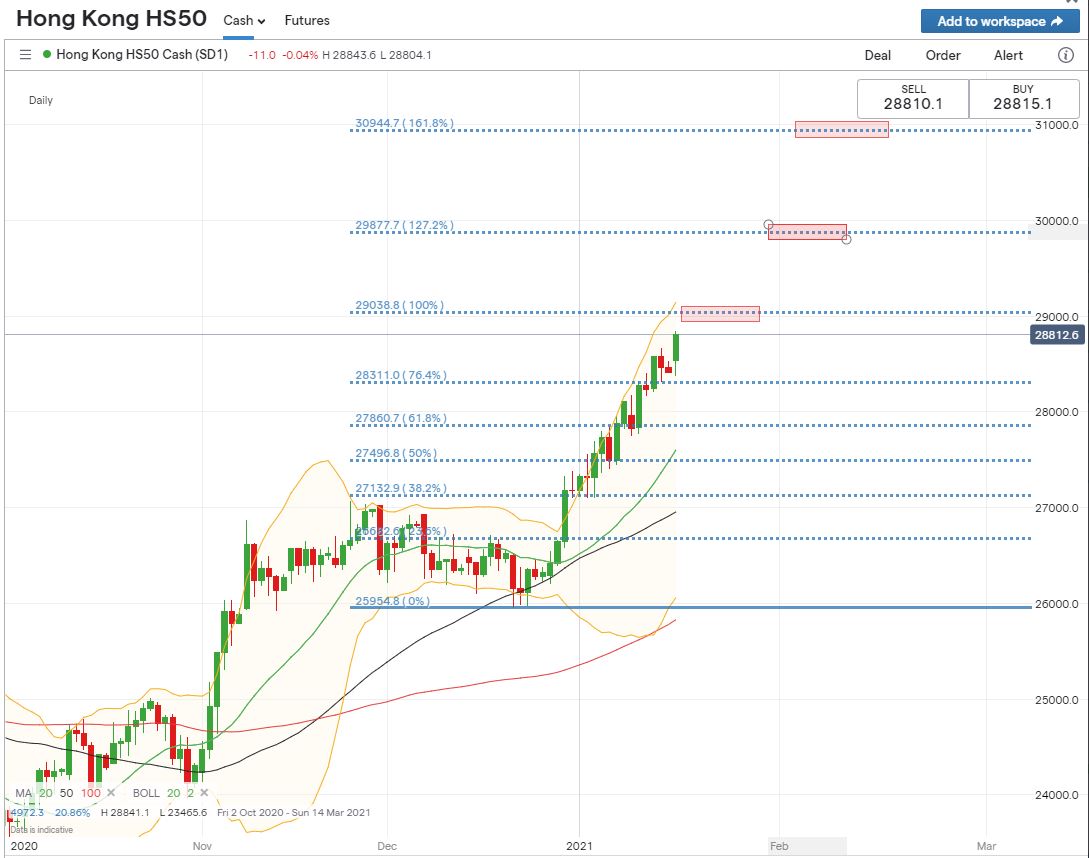
Chart by IG
- Trading guides and forecasts
- DailyFX offers equity trading forecast and top trading opportunities
- You may find more useful information in DailyFX trading guides here
- Learn how to trade FX for stock traders
--- Written by Margaret Yang, Strategist for DailyFX.com
To contact Margaret, use the Comments section below or @margaretyjy on Twitter