


The Elliott wave patterns for DXY and EUR/USD show potential for continued US Dollar weakness. S&P 500 may see new highs in a terminal wave.
The video above is a recording of a US Opening Bell webinar from October 21, 2019. We focused on the Elliott wave patterns for key markets such as US Dollar Index, EURUSD, GBPUSD, USDJPY, silver, gold, S&P 500 and Ethereum.
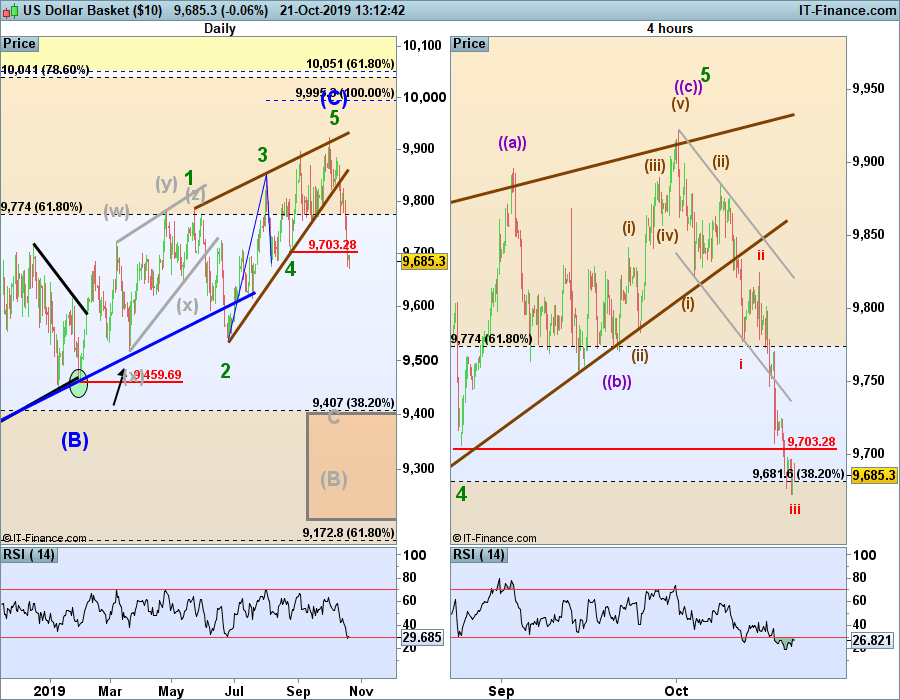
US Dollar Index Breaks Support Opening Door to 94.60
US Dollar Index finally broke lower after drifting into a high on October 1. From an Elliott wave perspective, this high appears very important as several wave pictures point towards a retracement down to 94.60. From there, some of the models diverge with some wave counts pointing to even lower levels into the 80’s.
Let’s take this one step at a time and see if DXY is successful is dropping down below 94.60. From there, we can assess the probabilities of the various wave counts.
According to the intraday Elliott wave chart on the right, we are in wave iii of (iii). This suggests more waves lower to finish of iv-v-(iv)-(v).
Read also: how to trade US Dollar Index
EURUSD Broke the Trendline, Evidence Builds a Meaningful Low is in Place
EUR/USD has rallied as forecasted on October 1. At that time, we suggested a rally above 1.1115 would be enough to consider a meaningful low in place. Last week, EUR/USD found enough strength to rally beyond this key level.
It appears EURUSD is in wave .iii of 3 and therefore is in a buy the dip bias. Additionally, trader sentiment recently flipped on October 10 to being net negative on a daily basis (a bullish signal). The current IG Client Sentiment read of 61% short is the largest reading of short traders since March 2019. At the current juncture of price, it would be normal if EURUSD dipped back near 1.11, but under the current wave picture it would need to hold above 1.1063 with targets still pointing towards 1.18.

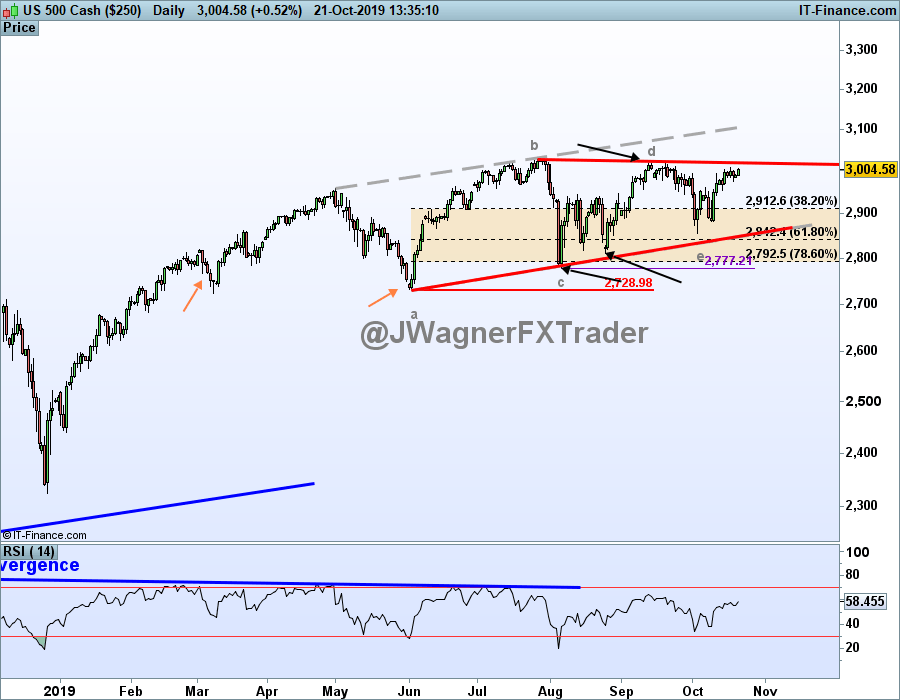
S&P500 Moves Higher…Slowly
S&P500 can’t shake the trading range and is nearing the highs of the range. The price action and Elliott wave structure suggests to me that new highs are nearby. It would be normal for new highs to work up to levels near 3300, though it doesn’t have to. The placement of this large triangle is a giveaway that if a run to new highs takes share, it would be a terminal wave as jumps out of triangles are terminal at the same degree of trend.
Therefore, rallies are viewed as temporary and a break of the support trend line would become more significant. A lower low below 2777 shifts the bias to focus on the December 2018 retest of the low.
Read also: How to trade S&P 500
Ethereum price forecast is for higher levels
From the low in December 2018 to the next low in September 2019, this pattern is an Elliott wave 5-3 structure. If my assessment of this pattern is correct, then the ETH/USD price outlook is bullish for the cryptocurrency and a large rally may be under foot to above $364 and higher levels.
Watch the green resistance channel line for additional confirmation of the rally. A break above the green trend line suggests the downtrend wave from June 2019 is over and opens the door to the ‘X’ wave high near 250. A similar pattern is found in Bitcoin, though not as clear as Ether at the moment.

Learn more on Elliott wave including the rules and guidelines by grabbing these beginners and advanced Elliott Wave trading guides.
After reviewing the guides above, be sure to follow future Elliott Wave articles to see Elliott Wave Theory in action.
---Written by Jeremy Wagner, CEWA-M
Jeremy Wagner is a Certified Elliott Wave Analyst with a Master’s designation. Jeremy provides Elliott Wave analysis on key markets as well as Elliott Wave educational resources. Read more of Jeremy’s Elliott Wave reports via his bio page.
Join Jeremy in his live US Opening Bell webinar where these markets and more are discussed through Elliott wave theory.
Follow Jeremy on Twitter at @JWagnerFXTrader .
Recent Elliott Wave analysis you might be interested in…
EURUSD Elliott Wave forecast – enough evidence points to a large rally


