


FX Price Action Setups Talking Points:
- A number of themes remain in the headlines and this morning brought another around the potential for more QE out of the European Central Bank.
- This may finally give the Euro what its been looking for to push down to the 1.1000 handle in EUR/USD; but EUR/JPY may be a more attractive breakout candidate. Both are looked at below.
- DailyFX Forecasts are published on a variety of markets such as Gold, the US Dollar or the Euro and are available from the DailyFX Trading Guides page. If you’re looking to improve your trading approach, check out Traits of Successful Traders. And if you’re looking for an introductory primer to the Forex market, check out our New to FX Guide.
ECB with More QE
The moves have continued through global markets as an earlier announcement out of the ECB’s Ollie Rehn informed that the ECB was investigating ‘something big’ for their September rate decision. This, of course, points to the possibility of more stimulus out of the European Central Bank, and this couples with the prior hints towards another rate cut out of the bank at that next meeting.
So, while the Fed has been rather silent around future action after the rate cut from a couple of weeks ago, the ECB has already tipped their hand that more stimulus is around-the-corner. This has helped the Euro to push down to the 1.1100 handle against the US Dollar, and given the potential for further losses in the single currency on this new piece of information, the door may finally be opened for a downside break in EUR/USD. The elusive revisit to the 1.1000 psychological level may soon be around the corner.
EUR/USD Four-Hour Price Chart
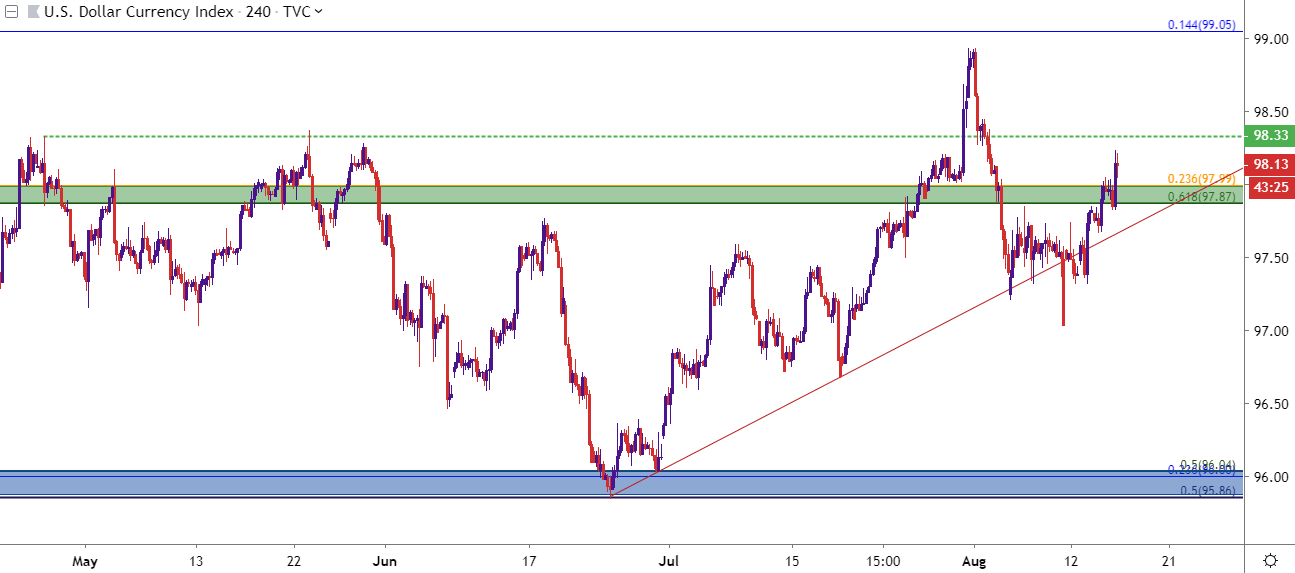
Chart prepared by James Stanley; EURUSD on Tradingview
As a collateral impact of that announcement earlier this morning and the downside push in EUR/USD, the US Dollar has forced a topside push back-up to fresh weekly highs. The door may be open for more but picking spots will be of the upmost importance here. A pullback to support at prior resistance, taken from around the 98-handle, keeps the door open for more.
US Dollar Four-Hour Price Chart

Chart prepared by James Stanley; US Dollar on Tradingview
GBP/USD Holding Long-Term Trend-Line
On the short-side of the US Dollar, GBP/USD came to life this morning after the pair took on a beleaguered tone from months of selling. Previously, I had looked at a long-term trendline helping to set the lows. That trendline did get breached this week but, at this point, prices have pushed back-above.
GBP/USD Monthly Price Chart
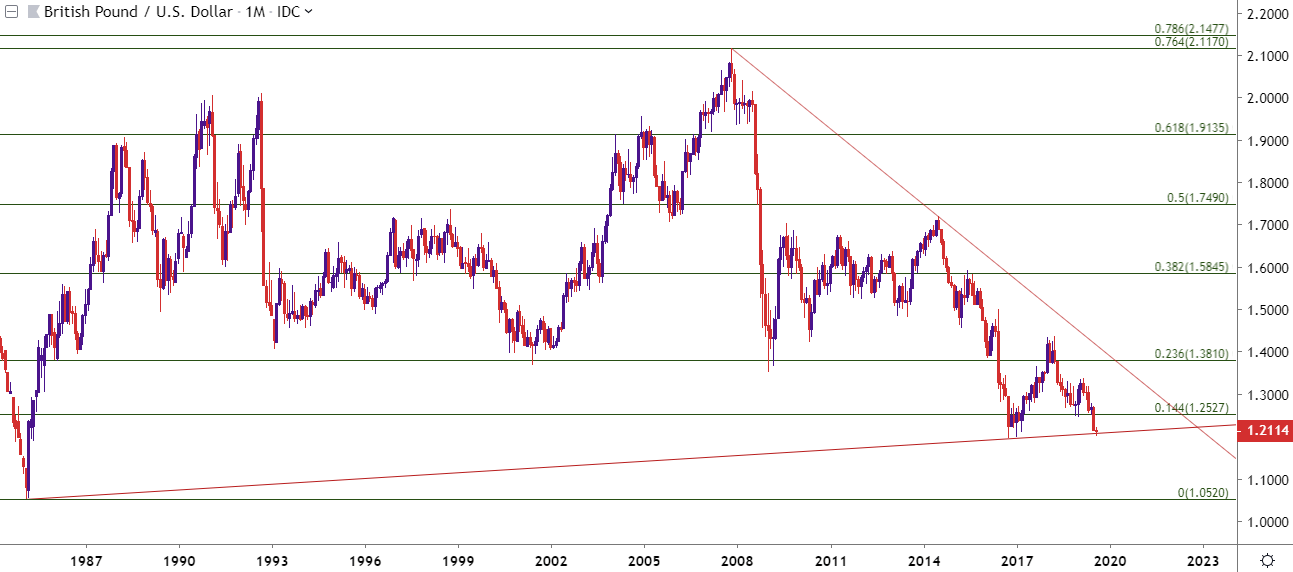
Chart prepared by James Stanley; GBPUSD on Tradingview
On a shorter-term basis, the pair has started to show some bullish potential as denoted by a recent higher-high following a series of higher-lows. The pair appears to be now attempting to cauterize another item of higher-low support from prior resistance, taken from around the 1.2100 area on the chart. This could keep the door open for short-term bullish strategies; and for those looking to hedge of USD-risk in the short EUR/USD theme, this could be an attractive option to match that up with.
GBP/USD Hourly Price Chart

Chart prepared by James Stanley; GBPUSD on Tradingview
USD/CAD Nears Resistance Potential
The topside theme has continued in USD/CAD after the earlier-week visit back down to 1.3200. As looked at yesterday, the big question is for how long this recovery might last and it looks as though prices are poised to soon set a fresh three-week-high. But, just above is an area of potential resistance that runs from 1.3361-1.3385; and this could re-open the door for bearish swings should resistance begin to show in this area of prior support.
USD/CAD Four-Hour Price Chart
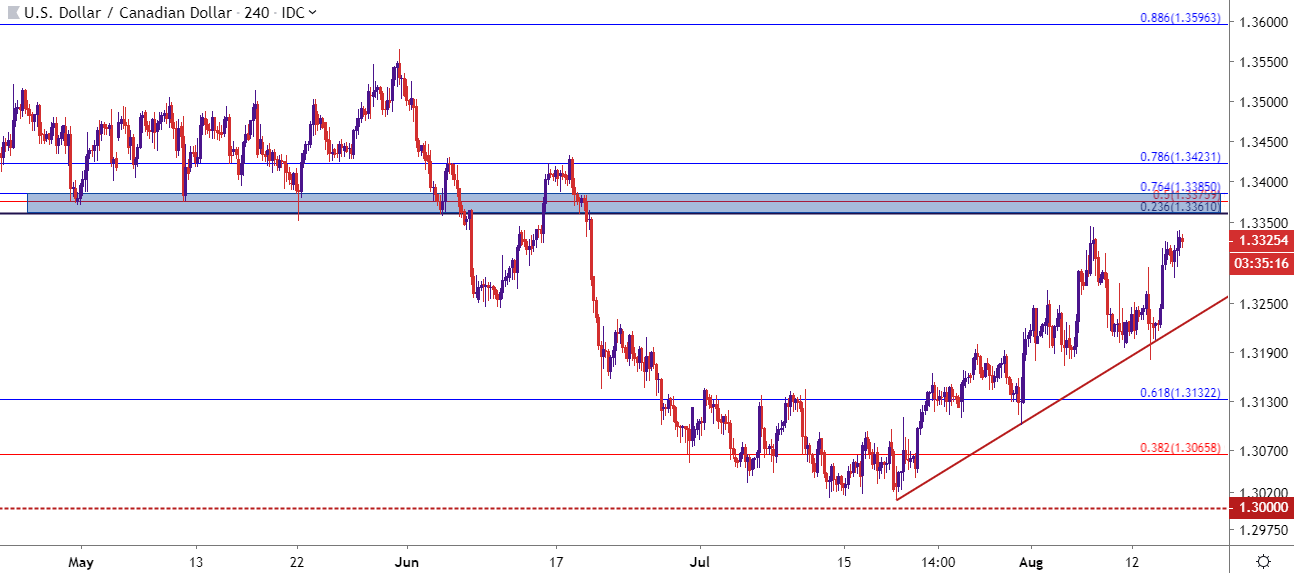
Chart prepared by James Stanley; USDCAD on Tradingview
USD/JPY: Attempting to Base Support
It’s been a struggle between bulls and bears in USD/JPY so far this week. Short-term moves have been volatile and erratic but, when taken with scope, it does appear as though the pair is attempting to set some support. That said, given recent moves in bond markets combined with a lack of bullish price action, and it could be difficult to justify a bullish approach here. Instead, this theme around the Yen could be extrapolated through EURJPY and GBPJPY, as looked at below.
USD/JPY Weekly Price Chart

Chart prepared by James Stanley; USDJPY on Tradingview
EUR/JPY Breakdown Potential Below 117.50
Given the recent pricing-in of ECB QE potential to go along with the risk aversion theme of Yen-strength, and the short-side of EUR/JPY may carry some interest. The pair is knocking on the door of support around the 117.50 level on the chart. This could keep the door open for short-side breakouts in the pair that could be particularly attractive in the event of continued risk aversion.
EUR/JPY Daily Price Chart

Chart prepared by James Stanley; EURJPY on Tradingview
GBP/JPY Builds Support From Some Longer-Term Areas
I had looked at this one on Tuesday but given the GBP recovery earlier this morning, the setup looks a bit more attractive now at this point. A longer-term trend-line came into play on Tuesday and this was followed by a higher-low around the 126.87 Fibonacci level. Price action has since found higher-low support off of 127.50, keeping the door open for bullish reversal scenarios targeting towards the 130.00 psychological level.
GBP/JPY Hourly Price Chart
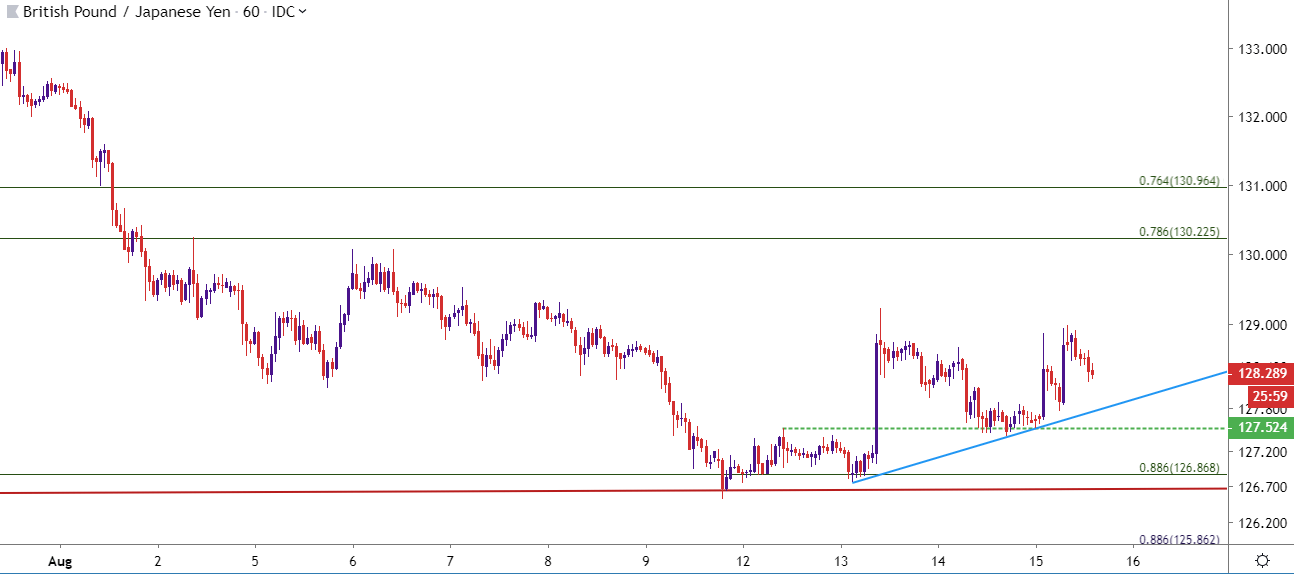
Chart prepared by James Stanley; GBPJPY on Tradingview
S&P 500 Tenuously Holding Support
Support is still there in US equity indices, particularly of the large cap variety and this can keep the door open for bullish swing scenarios. Bearish scenarios may be more attractive in an area like the Russell 2000, looked at below.
S&P 500 Four-Hour Price Chart

Chart prepared by James Stanley; SPX500 on Tradingview
Russell 2000 May Be More Attractive for Risk Aversion Scenarios in Stocks
While the S&P 500 ripped up to a fresh all-time-high earlier this year, the recovery in the Russell 2000 was far more mild, setting a lower-high and continuing to trade more tenuously than larger-cap indices. This can keep the door open for bearish potential, particularly for those looking at an extension of risk aversion. Below is the ETF around the Russell 2000 index with a ticker of ‘IWM,’ and a break of the support zone that run from 243-244 opens the door for a deeper slide.
Russell 2000, IWM Weekly Price Chart

Chart prepared by James Stanley; IWM on Tradingview
To read more:
Are you looking for longer-term analysis on the U.S. Dollar? Our DailyFX Forecasts have a section for each major currency, and we also offer a plethora of resources on Gold or USD-pairs such as EUR/USD, GBP/USD, USD/JPY, AUD/USD. Traders can also stay up with near-term positioning via our IG Client Sentiment Indicator.
Forex Trading Resources
DailyFX offers an abundance of tools, indicators and resources to help traders. For those looking for trading ideas, our IG Client Sentiment shows the positioning of retail traders with actual live trades and positions. Our trading guides bring our DailyFX Quarterly Forecasts and our Top Trading Opportunities; and our real-time news feed has intra-day interactions from the DailyFX team. And if you’re looking for real-time analysis, our DailyFX Webinars offer numerous sessions each week in which you can see how and why we’re looking at what we’re looking at.
If you’re looking for educational information, our New to FX guide is there to help new(er) traders while our Traits of Successful Traders research is built to help sharpen the skill set by focusing on risk and trade management.
--- Written by James Stanley, Strategist for DailyFX.com
Contact and follow James on Twitter: @JStanleyFX


