


USDCAD Talking Points:
- USD/CAD put in an aggressively bearish move in June and July, eventually finding support just above the 1.3000 handle.
- Since then, a bullish reversal has taken-hold and prices have retraced 50% of that prior sell-off.
- DailyFX Forecasts are published on a variety of markets such as Gold, the US Dollar or the Euro and are available from the DailyFX Trading Guides page. If you’re looking to improve your trading approach, check out Traits of Successful Traders. And if you’re looking for an introductory primer to the Forex market, check out our New to FX Guide.
USD/CAD Retracement Continues
It was a month ago now that USD/CAD had bottomed-out. While the pair had spent much of the prior 17 months trending-higher, sticking to a bullish trendline for much of the time, the month of June brought a strong change of pace as the US Dollar fell while the Canadian Dollar strengthened. Out of the US, the USD was being driven lower by the prospect of rate cuts from the FOMC, and in Canada, a strong inflation print highlighted the fact that the BoC likely wouldn’t be able to adopt a similar stance. In short-order, USD/CAD fell from a late-May high above 1.3500 all the way down to the 1.3000 handle in mid-July. At that point, sellers began to shy away from a test of the big figure and later in the month, a falling wedge formation had formed, pointing to the potential for a bullish reversal. That theme has played out and almost a month later, continues to hold.
USD/CAD Weekly Price Chart
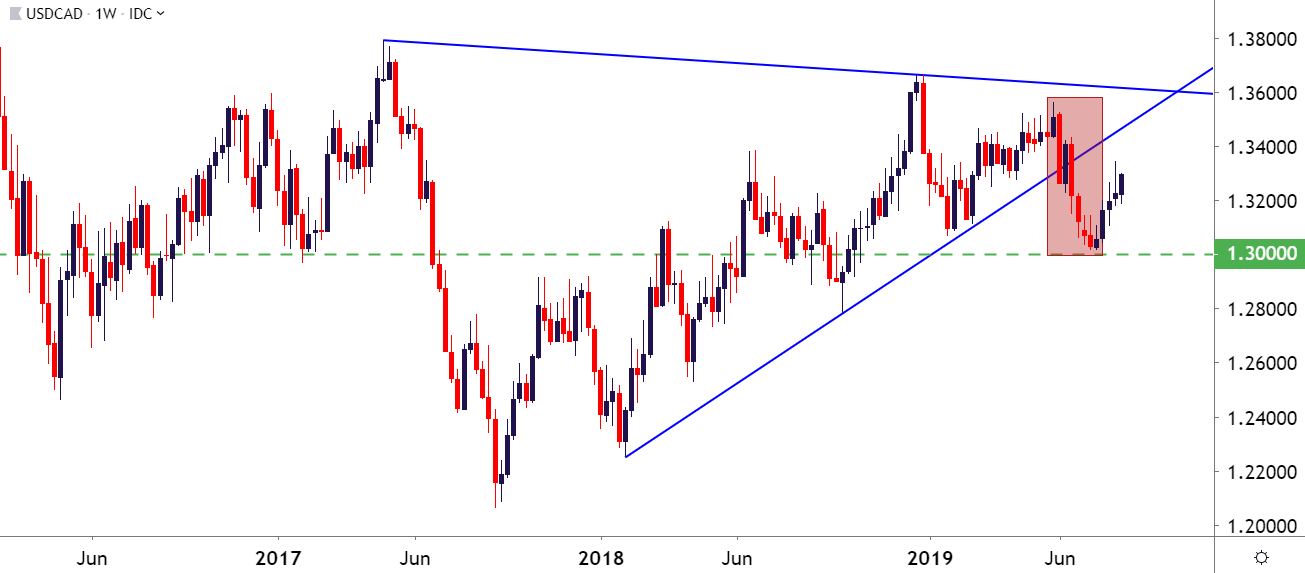
Chart prepared by James Stanley; USDCAD on Tradingview
Canadian inflation moderated in June, dropping back down to 2% after printing at 2.4% for the month of May. That 2.4% print is what helped to drive strength in the currency during that run in June, and the fact that this pulled back a bit is what’s helped CAD weakness to return over the past month. The next Canadian inflation print is due in a week, released next Wednesday morning at 8:30 AM ET. This will likely be the next major push point in the pair.
At this point, USD/CAD is finding resistance around the 50% retracement of that June-July sell-off, and this is around a series of support swings that showed-up in April and May of this year.
USD/CAD Daily Price Chart
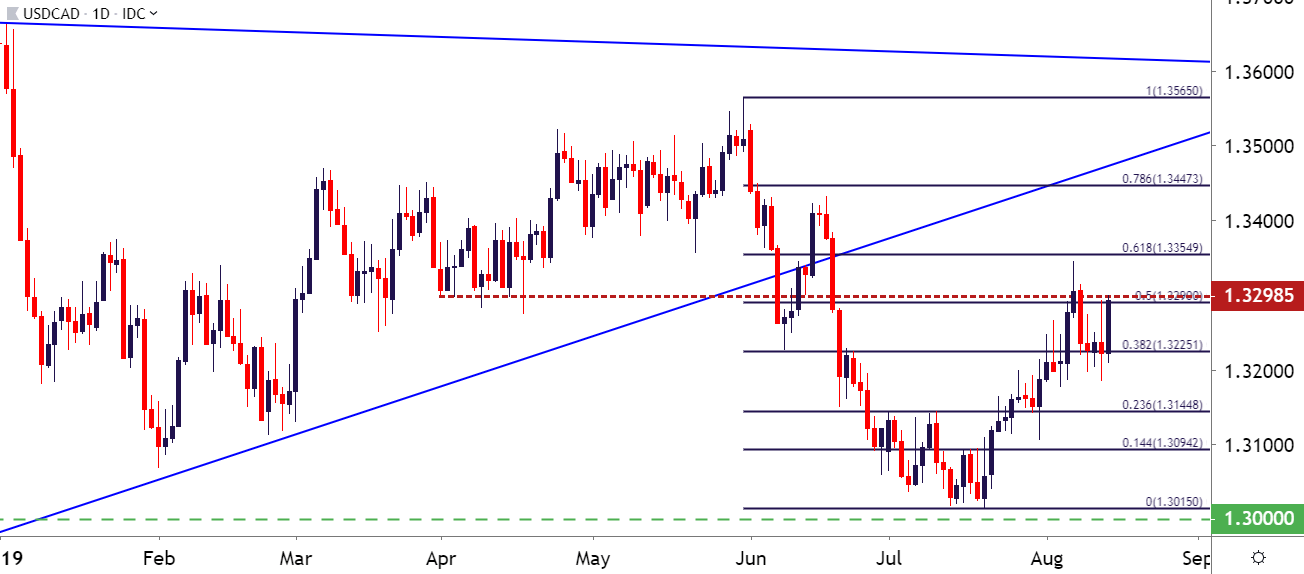
Chart prepared by James Stanley; USDCAD on Tradingview
USD/CAD Strategy
Given the month-long theme of strength in the pair following the aggressive sell-off that showed previously, and there could be scope for further recovery until the short-side of the pair comes back into favor. And taking a step back on the chart, there is a nearby zone of interest for longer-term resistance potential. This rests from the confluent area on the chart that runs from 1.3361-1.3385.
USD/CAD Eight-Hour Price Chart
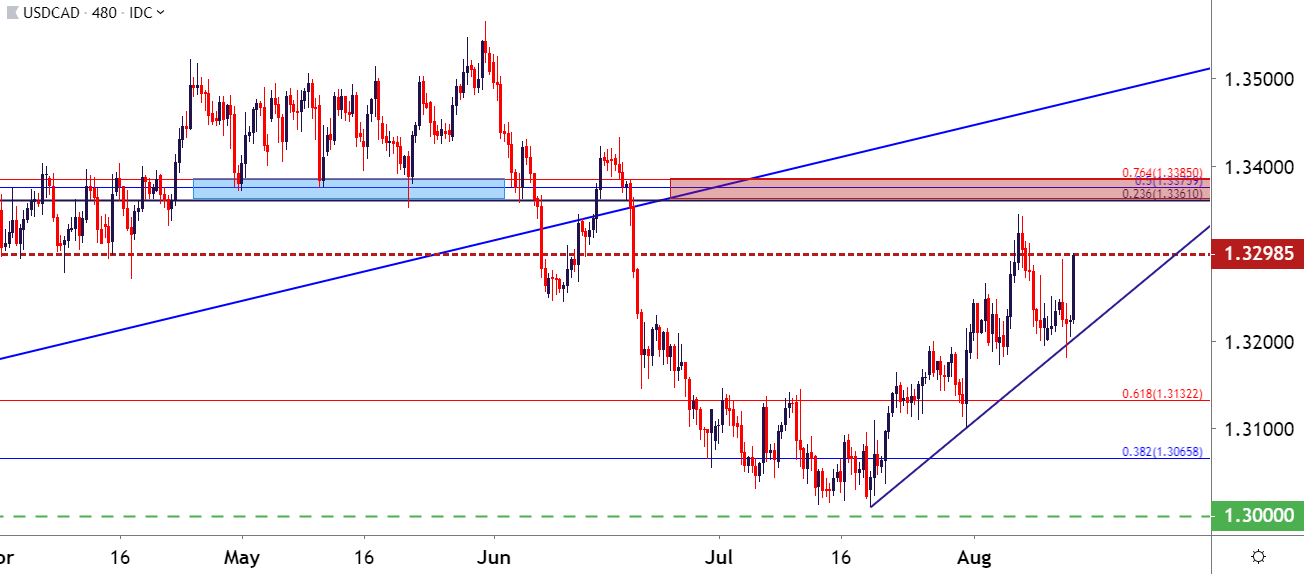
Chart prepared by James Stanley; USDCAD on Tradingview
USDCAD: Timing Bearish Reversals
Similar to the backdrop in mid-July, traders are likely going to want to look for some evidence of topping before plotting for bearish reversal scenarios. In mid-July, sellers began to slow the approach as prices pushed towards the 1.3000 big figure. After a continued failure to test the psychological level, a falling wedge formation eventually formed, which allowed for a backdrop conducive for bullish reversals, as looked at last month. My final target on the pair was the 1.3250-1.3000 zone, at which point I wanted to start looking to take the pair back-down. That zone hasn’t yet presented enough evidence that the short-side of USD/CAD may be attractive, and this is what brings into play the potential for that higher zone around 1.3361-1.3385 to become usable again.
But, at this point, the near-term bullish trend is strong and well-extended, thereby producing a difficult scenario for managing risk on topside strategies.
USD/CAD Four-Hour Price Chart
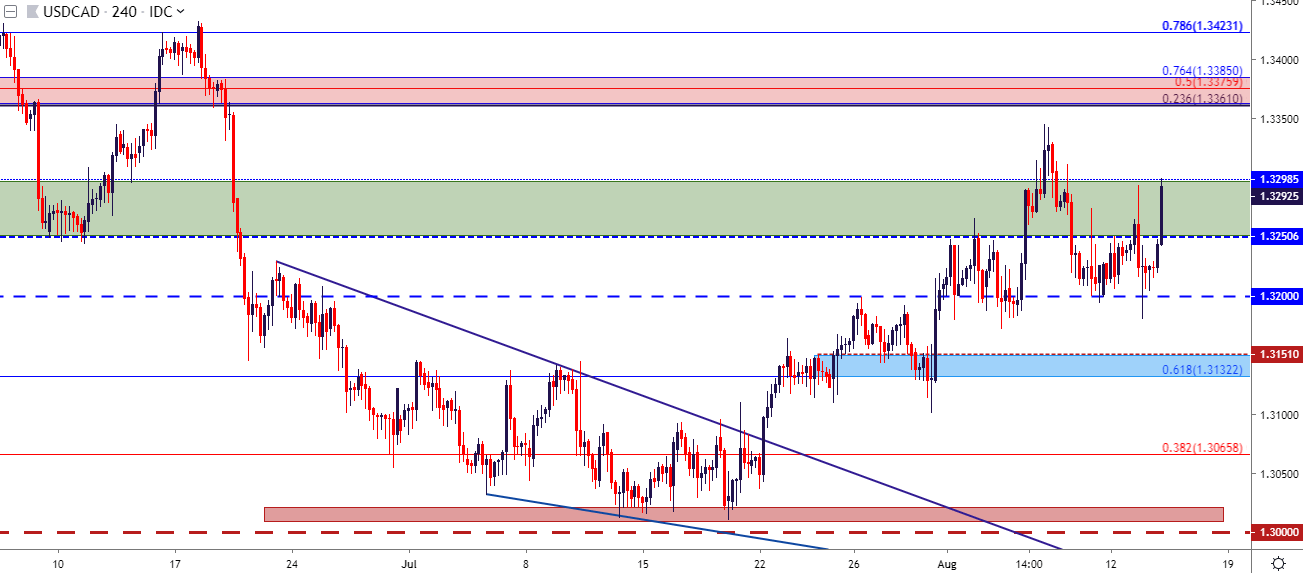
Chart prepared by James Stanley; USDCAD on Tradingview
To read more:
Are you looking for longer-term analysis on the U.S. Dollar? Our DailyFX Forecasts have a section for each major currency, and we also offer a plethora of resources on Gold or USD-pairs such as EUR/USD, GBP/USD, USD/JPY, AUD/USD. Traders can also stay up with near-term positioning via our IG Client Sentiment Indicator.
Forex Trading Resources
DailyFX offers an abundance of tools, indicators and resources to help traders. For those looking for trading ideas, our IG Client Sentiment shows the positioning of retail traders with actual live trades and positions. Our trading guides bring our DailyFX Quarterly Forecasts and our Top Trading Opportunities; and our real-time news feed has intra-day interactions from the DailyFX team. And if you’re looking for real-time analysis, our DailyFX Webinars offer numerous sessions each week in which you can see how and why we’re looking at what we’re looking at.
If you’re looking for educational information, our New to FX guide is there to help new(er) traders while our Traits of Successful Traders research is built to help sharpen the skill set by focusing on risk and trade management.
--- Written by James Stanley, Strategist for DailyFX.com
Contact and follow James on Twitter: @JStanleyFX


