


US Dollar Talking Points:
- This morning brought inflation numbers for the month of July out of the US and both headline and core cpi came out above expectations.
- There was additional news on the tariff front, as well, with positive items showing from both the Chinese and US sides. This has helped to arrest the recent round of risk-off, and may keep the door open for more.
- DailyFX Forecasts are published on a variety of markets such as Gold, the US Dollar or the Euro and are available from the DailyFX Trading Guides page. If you’re looking to improve your trading approach, check out Traits of Successful Traders. And if you’re looking for an introductory primer to the Forex market, check out our New to FX Guide.
It’s been a busy morning across global markets, led by a strong bullish move in stocks on the heels of this morning’s announcement of a delay on tariffs. This morning also brought a CPI print into the mix, and inflation in the US came-out stronger than expected with headline printing at 1.8% and Core CPI, stripping out food and energy, printing at 2.2%. This was the highest print in that indicator since January of this year and it’s the 17th consecutive month of Core CPI printing above the Fed’s 2% target.
But, it wasn’t shortly after that that another item of news came-in on the tariff front, and this time it happened from both sides. China said that they were expecting to hold talks over the phone in two weeks, and the US said that tariffs on laptops and cell phones would go into effect on December 15th as opposed to the initial schedule of September 1. That removes a bit of pressure from the recent sell-off in stocks that showed up a couple of weeks ago, and the S&P 500 quickly moved up to a fresh near-term high.
At this point, given the backdrop and the combination of drivers, the door could be open for more, particularly if this feel-good environment lasts through the Asian session tonight.
S&P 500 Two-Hour Price Chart
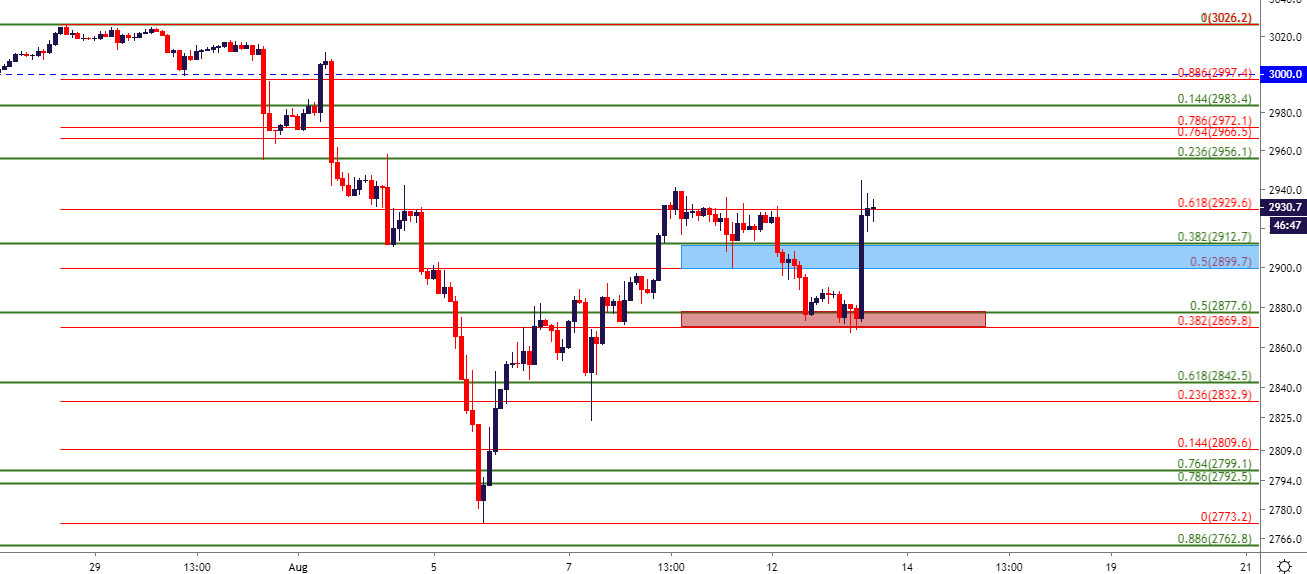
Chart prepared by James Stanley; SPX500 on Tradingview
US Dollar Catches a Bounce – but Can Bulls Hold the Line
The combo of this morning’s news on US inflation and positive items on the tariff front have collectively helped to build a bounce in the US Dollar. The Fed is still expected to cut rates again later this year, but the big question at this point is by how much? This can help to retain a bearish bias on the currency as we likely aren’t going to see the bank hawk up expectations but, likely, this is more of a question of how dovish they’ll go and when.
US Dollar Weekly Chart: Rising Wedge, Recent Inverted Hammer on Weekly

Chart prepared by James Stanley; US Dollar on Tradingview
EUR/USD Can Still Break in Either Direction – Bias to the Upside
EUR/USD continues to range around a key zone on the chart that runs from 1.1187-1.1212. There hasn’t yet been a definitive break in one direction or the other and this thing could literally push in either direction, likely as determined by USD flows. I’m personally looking at this with a topside bias in expectation of a longer-term short-squeeze scenario playing out.
EUR/USD Daily Price Chart
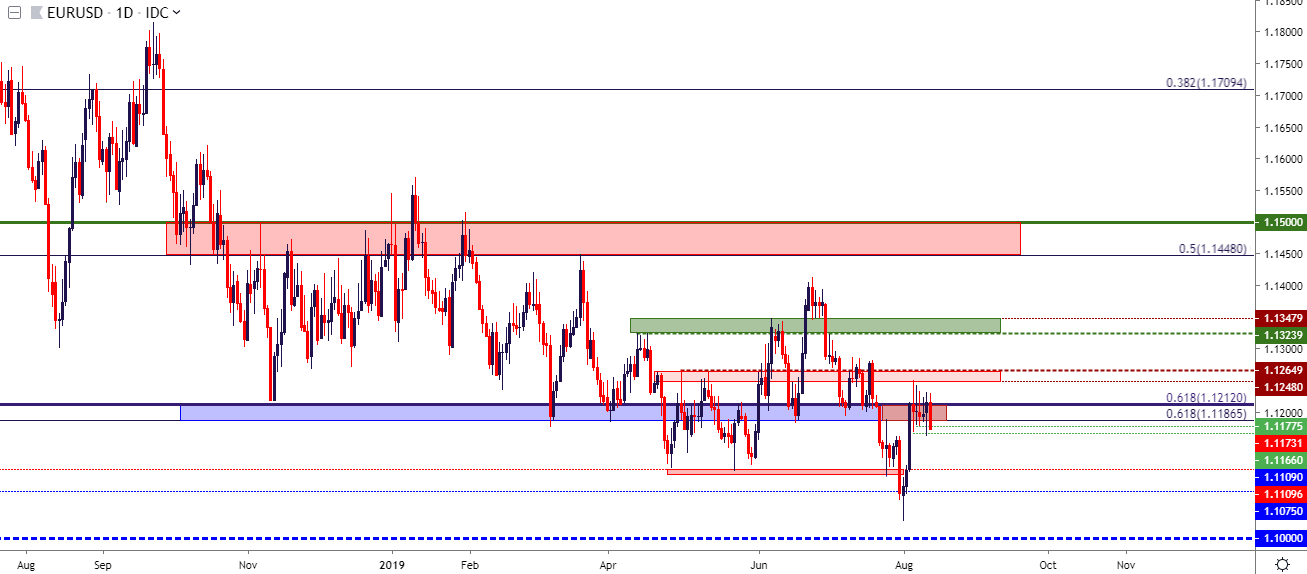
Chart prepared by James Stanley; EURUSD on Tradingview
USD/CAD Carries Bearish Potential
Also on the short-side of the US Dollar, I started to look at USD/CAD last week. The pair put in a strong bullish reversal in mid-July and that theme ran for the next few weeks. That topping scenario has seen some additional pieces fall into place, accented by a lower-high in the 3250-3300 zone, and this can keep the door open for short-side setups in the pair.
USD/CAD Eight-Hour Price Chart
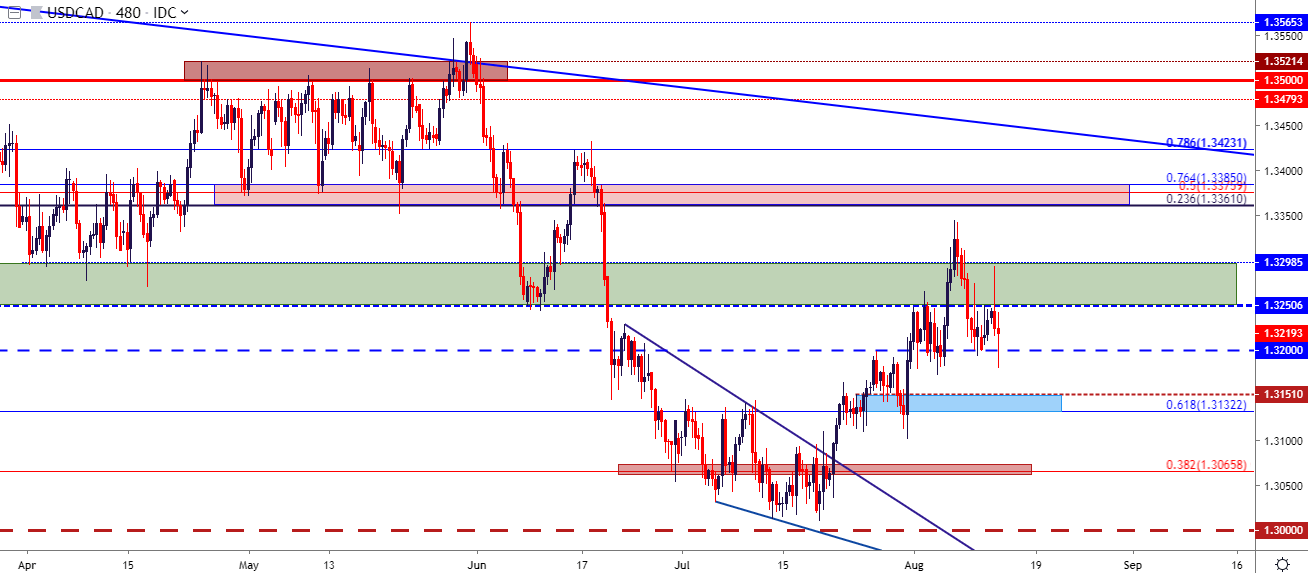
Chart prepared by James Stanley; USDCAD on Tradingview
GBP/USD: Caution around Chasing Cable
The British Pound has been mired in a hard down-trend for a few months now, coming very close to a test of the 1.2000 psychological level. Bears haven’t shown much interest in a showdown there as of yet, and this could make bearish continuation scenarios a bit of a challenge at the moment. It can, however, open the door for resistance potential as taken from prior support swings, such as 1.2117 or a bit higher around 1.2150.
GBP/USD Two-Hour Price Chart
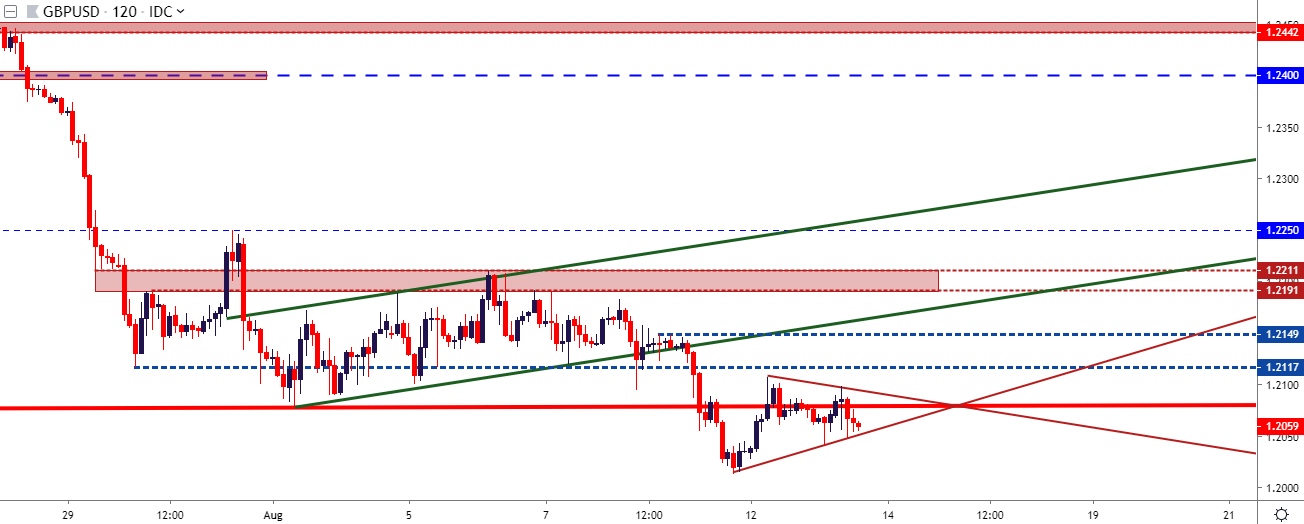
Chart prepared by James Stanley; GBPUSD on Tradingview
USD/CHF Bounce from Fresh 2019 Lows
USD/CHF caught a reprieve around this morning’s drivers. The pair had previously pushed down to a fresh 2019 low, crossing inside of the .9700 handle as sellers continued to push. This quick flare of USD-strength has allowed for the pair to push back towards a prior area of resistance interest, and this runs from the psychological .9750 up to .9766. A bit higher, resistance potential also exists at the prior spot of support around the .9800 handle.
USD/CHF Four-Hour Price Chart
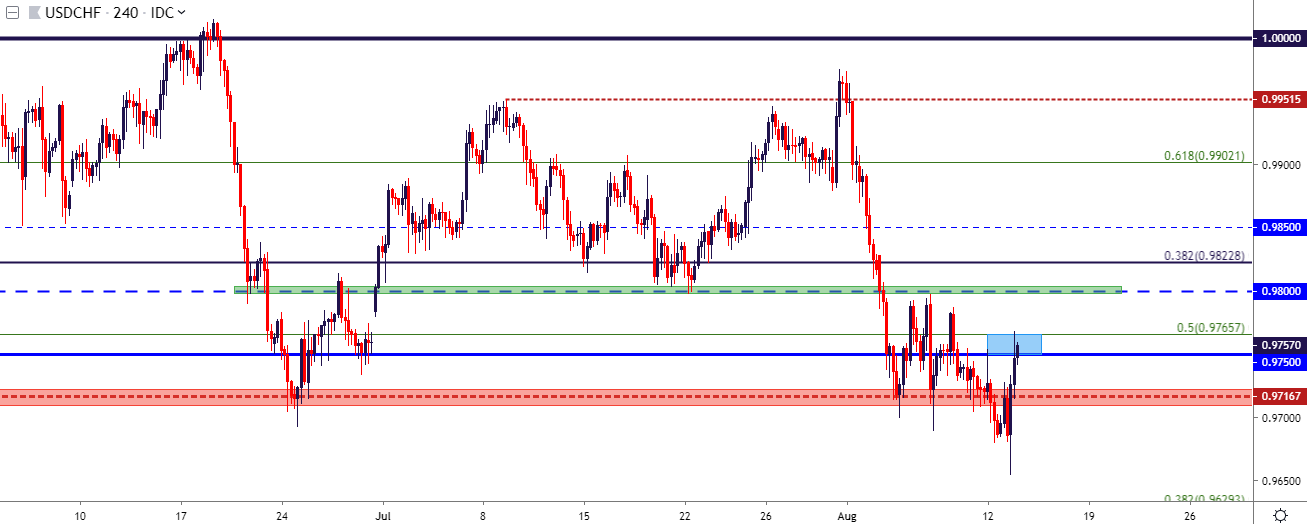
Chart prepared by James Stanley; USDCHF on Tradingview
Gold Hits Resistance – Is this What Brings the Pullback?
Gold prices have been overbought for some time now, driven by a potent cocktail of both fear and greed. But with a bit of cessation on the fear front, prices have put in a vigorous pullback so far today, temporarily trading below the 1480 marker before bouncing back up to 1500. And while I may not want to look at the short-side of this scenario at this point, it can be enough to start plotting support from prior resistance levels to look for a larger retracement. That prior area of rigid resistance at 1421-1433 has yet to be tested for support after the early-August breakout.
Gold Weekly Price Chart

Chart prepared by James Stanley; Gold on Tradingview
To read more:
Are you looking for longer-term analysis on the U.S. Dollar? Our DailyFX Forecasts have a section for each major currency, and we also offer a plethora of resources on Gold or USD-pairs such as EUR/USD, GBP/USD, USD/JPY, AUD/USD. Traders can also stay up with near-term positioning via our IG Client Sentiment Indicator.
Forex Trading Resources
DailyFX offers an abundance of tools, indicators and resources to help traders. For those looking for trading ideas, our IG Client Sentiment shows the positioning of retail traders with actual live trades and positions. Our trading guides bring our DailyFX Quarterly Forecasts and our Top Trading Opportunities; and our real-time news feed has intra-day interactions from the DailyFX team. And if you’re looking for real-time analysis, our DailyFX Webinars offer numerous sessions each week in which you can see how and why we’re looking at what we’re looking at.
If you’re looking for educational information, our New to FX guide is there to help new(er) traders while our Traits of Successful Traders research is built to help sharpen the skill set by focusing on risk and trade management.
--- Written by James Stanley, Strategist for DailyFX.com
Contact and follow James on Twitter: @JStanleyFX


