


US Dollar Talking Points:
- The US Dollar has been relatively quiet for the past couple of days after some strong moves in either direction.
- This webinar looked at a series of setups on either side of the USD, and below is a recap of a few of those setups.
- DailyFX Forecasts are published on a variety of markets such as Gold, the US Dollar or the Euro and are available from the DailyFX Trading Guides page. If you’re looking to improve your trading approach, check out Traits of Successful Traders. And if you’re looking for an introductory primer to the Forex market, check out our New to FX Guide.
US Dollar Digests After Last Week’s Inverted Hammer
The past two days of price action have brought a calmer backdrop in the US Dollar. The currency reversed aggressively last week on news of additional tariffs on China, helping to wipe out a rate-cut rally that had shown in the USD. That theme of weakness lasted into this week with the surprise pricing of the Chinese Yuan by the PBoC; but since a bit of calm has developed as the US Dollar has begun to digest this recent move. Support is showing around a trend-line projection as taken from June and mid-July swing-lows. Resistance is taking place inside of a couple of confluent Fibonacci levels, from 97.86-99.94. My bias is for weakness, largely looking to last week’s inverted hammer formation in the US Dollar.
US Dollar Four-Hour Price Chart
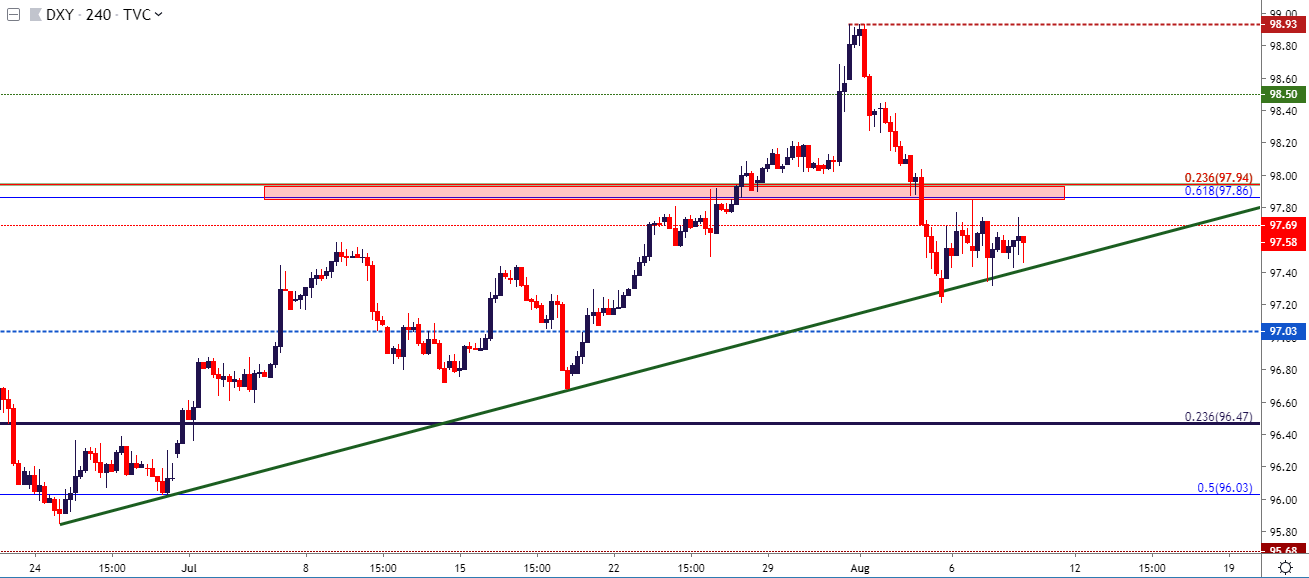
Chart prepared by James Stanley; US Dollar on Tradingview
EUR/USD Resistance Catches at Prior Support
EUR/USD may be set up for short-side swings. Resistance has held so far this week in the prior zone of support that runs from 1.1187-1.1212. This keeps the door open for bearish swings with stops above this week’s high around the 1.1250 level.
EUR/USD Daily Price Chart

Chart prepared by James Stanley; EURUSD on Tradingview
GBP/USD Long-Term Trendline, Sellers Continue to Push
The long-term trend-line that came into play last week is still helping to hold the lows.
GBP/USD Monthly Price Chart
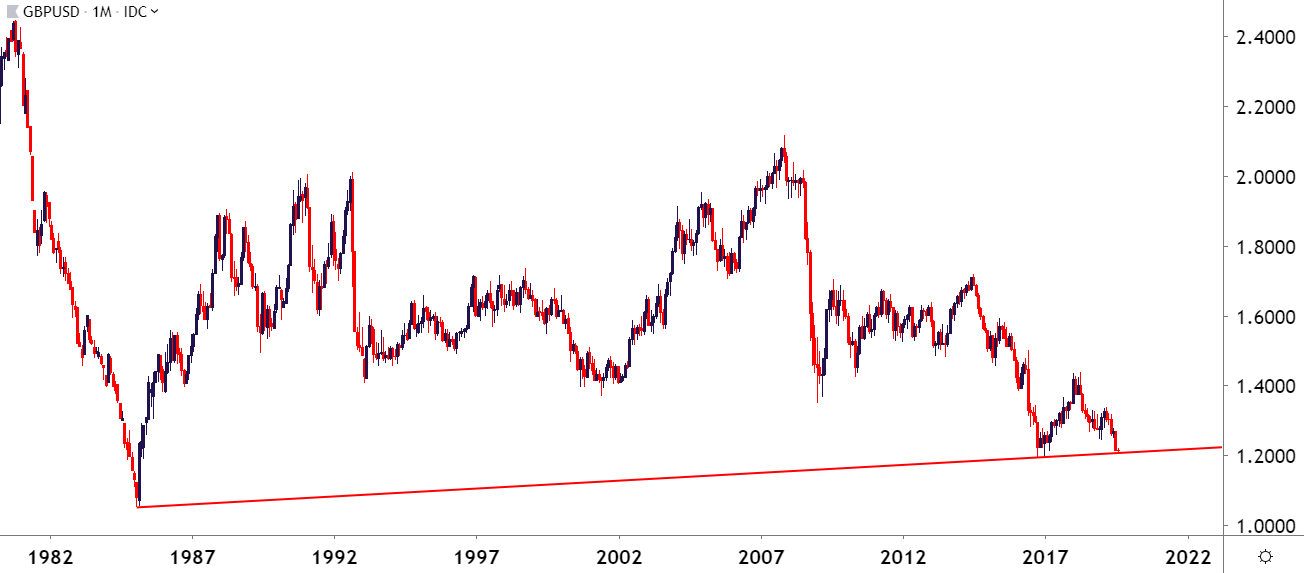
Chart prepared by James Stanley; EURUSD on Tradingview
As looked at earlier today, a short-term bear flag formation has shown up after that support bounce. It’s already started to give way, but the big question is whether sellers will be able to evoke a push down to the 1.2000 psychological level.
GBP/USD Hourly Price Chart

Chart prepared by James Stanley; GBPUSD on Tradingview
AUD/USD: Greater Reversal Potential After Capitulation?
AUD/USD also encroached upon a big level earlier this week when .6750 came into play. This was the 1999 high that helped to set early-2019 support after the flash crash.
AUD/USD Monthly Price Chart
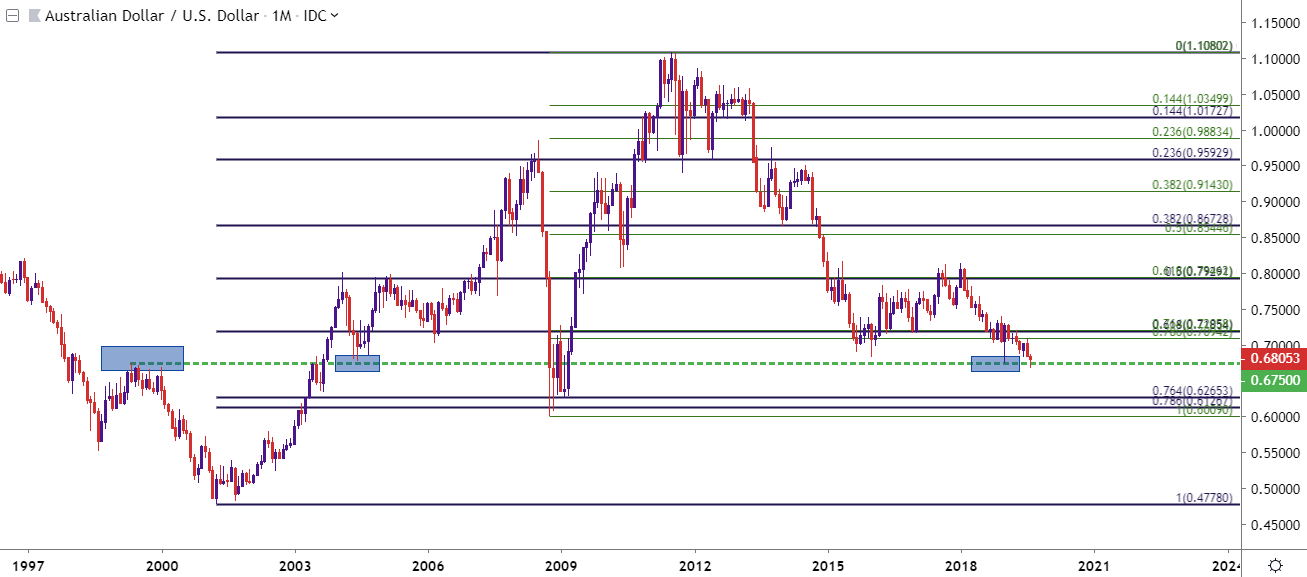
Chart prepared by James Stanley; AUDUSD on Tradingview
This longer-term support combined with potential capitulation begs the question as to whether the topside of the pair might have more room to run; and it may. This can keep focus on the area around .6775 for higher-low support.
AUD/USD Two-Hour Price Chart
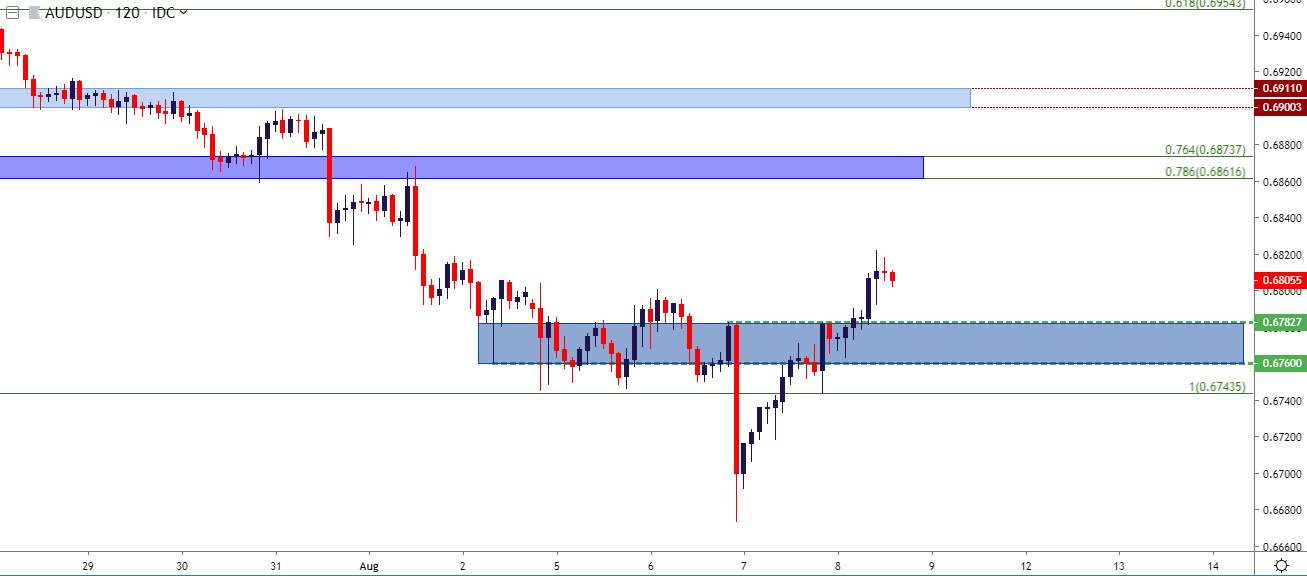
Chart prepared by James Stanley; AUDUSD on Tradingview
USD/CAD – Time to Reverse?
As looked at on Tuesday, USD/CAD had entered into my final target zone from 1.3250-1.3300 but, at the time, hadn’t yet shown any penchant for resistance much less reversal. Since then, however, the scenario has shifted – prices have broken back-below the 1.3250 marker, and this could soon re-open the door for bearish swing strategies in the pair.
USD/CAD Two-Hour Price Chart
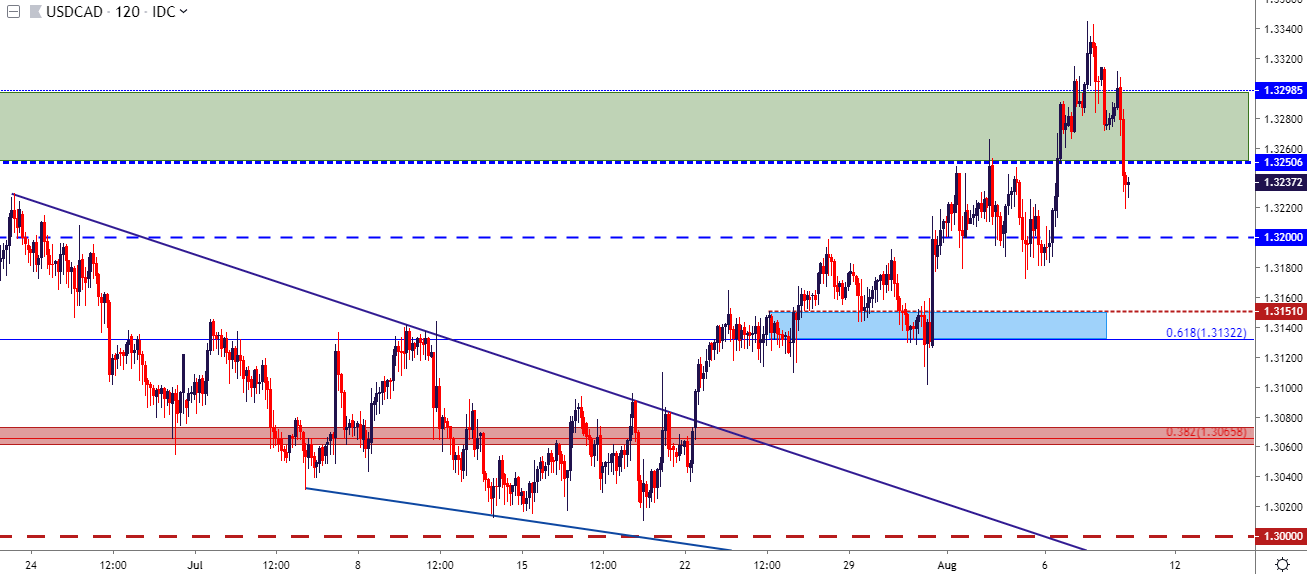
Chart prepared by James Stanley; USDCAD on Tradingview
To read more:
Are you looking for longer-term analysis on the U.S. Dollar? Our DailyFX Forecasts have a section for each major currency, and we also offer a plethora of resources on Gold or USD-pairs such as EUR/USD, GBP/USD, USD/JPY, AUD/USD. Traders can also stay up with near-term positioning via our IG Client Sentiment Indicator.
Forex Trading Resources
DailyFX offers an abundance of tools, indicators and resources to help traders. For those looking for trading ideas, our IG Client Sentiment shows the positioning of retail traders with actual live trades and positions. Our trading guides bring our DailyFX Quarterly Forecasts and our Top Trading Opportunities; and our real-time news feed has intra-day interactions from the DailyFX team. And if you’re looking for real-time analysis, our DailyFX Webinars offer numerous sessions each week in which you can see how and why we’re looking at what we’re looking at.
If you’re looking for educational information, our New to FX guide is there to help new(er) traders while our Traits of Successful Traders research is built to help sharpen the skill set by focusing on risk and trade management.
--- Written by James Stanley, Strategist for DailyFX.com
Contact and follow James on Twitter: @JStanleyFX


