


US Dollar, EUR/USD, GBP/USD, USD/CAD Talking Points:
- This morning brought the release of US CPI numbers for the month of July, and both headline and core CPI beat expectations.
- Core CPI remains incredibly stable with now 17 consecutive months above 2%. While this may unsettle the backdrop of expectations for more-dovish FOMC policy, many markets don’t appear to have yet reflected that, instead, fully expecting more rate cuts out of the Fed in the remainder of this year.
- DailyFX Forecasts are published on a variety of markets such as Gold, the US Dollar or the Euro and are available from the DailyFX Trading Guides page. If you’re looking to improve your trading approach, check out Traits of Successful Traders. And if you’re looking for an introductory primer to the Forex market, check out our New to FX Guide.
US Inflation Increases in July – But Will it/Can it Stop the Fed?
This morning brought another release of inflation data out of the US, and of recent this has been a big factor of curiosity as headline inflation had dwindled over the past 12 months while Core CPI, removing food and energy from the equation, remained sticky and strong. Core CPI came into this morning riding a streak of 16 consecutive months above the Fed’s 2% target. This created a bit of difficulty for a Federal Reserve looking to meet market demands with a dovish policy shift last month. Headline CPI, however, has been a far different story. After spiking up to 2.9% a year ago, this data point has pushed back below the Fed’s 2% target and has so far spent the past nine months in a range between 1.5 and 2%.
The item of interest at this point is the Fed’s September rate decision where markets are, again, showing a 100% expectation for a cut. There’s even a 11.9% chance for 50 basis points of softening when the FOMC meets next month.
US Rate Expectations to September 2019

Chart prepared by James Stanley
Going out to December brings even more questions as there’s an 88% probability of at least 50 basis points of softening by the end of this year, going along with a 42.4% chance of an additional 75 basis points worth of cuts.
US Rate Expectations to December 2019

Chart prepared by James Stanley
So with inflation continue to show strain, the big question is whether US Dollar weakness comes back as a dominant theme. This began to show shortly after last month’s rate cut, although it happened in a very unexpected manner. When the Fed cut rates without pledging any additional softening down-the-road, the US Dollar spiked up to a fresh two-year-high. But less than 24 hours later, President Trump announced additional tariffs on China, which further pushed the Fed into a corner with risks on the horizon given the potential slowdown as driven by the brewing trade war between China and the US.
That item doesn’t appear to going away anytime soon. President Trump has been very vocal about his desire for a weaker US Dollar and the current trade tension appears to be firmly within his control. The timing of that tariff announcement two weeks ago was likely not coincidental, and with the force of fiscal policy creating headwinds for monetary policy, it appears as though the Fed has little area to maneuver.
What this means in the US Dollar is the potential for lower prices. The currency came into Q3 with the showing a bearish reversal formation after a year-plus of strength. The rate cut rally produced a couple of weeks ago, at this point, appears to be a form of capitulation after the weekly candle in DXY built an inverted hammer, which can open the door to reversal potential.
US Dollar Weekly Price Chart

Chart prepared by James Stanley; US Dollar on Tradingview
Where Can USD Weakness be Most Attractive
First and foremost – Gold. Gold prices have been in a steady state of rip over the past few months as rate expectations around the Fed have been getting kicked lower. Gold prices are currently trading around fresh six-year-highs, extending that bullish run after this week’s open.
Gold Price Weekly Chart
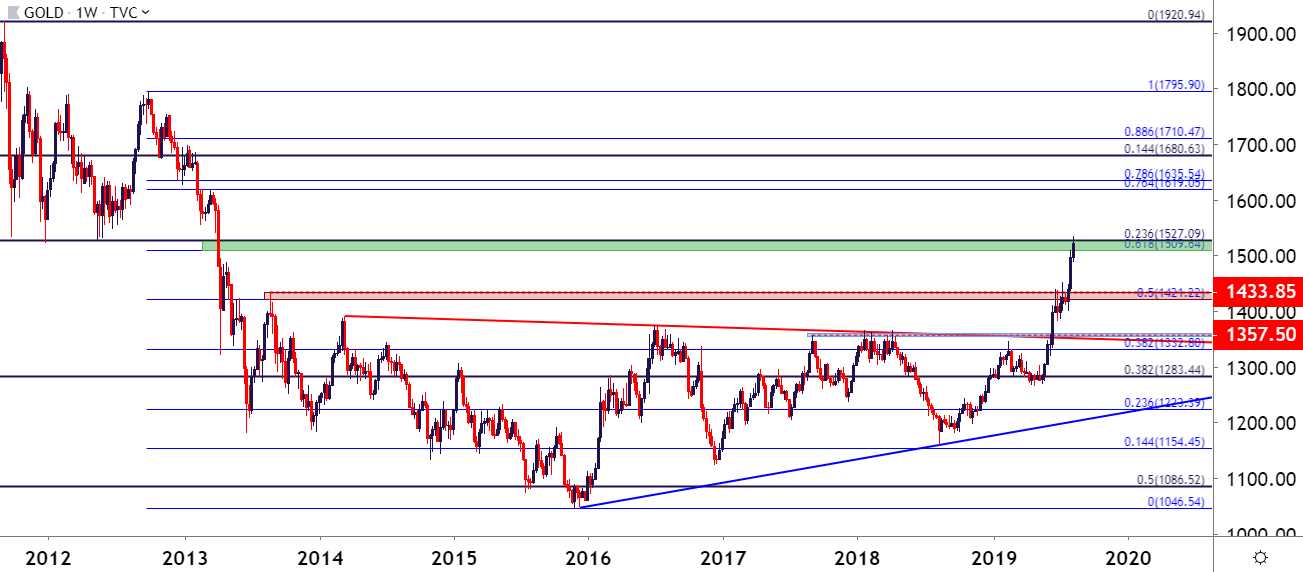
Chart prepared by James Stanley; Gold on Tradingview
EUR/USD Tango Continues – Can Bulls Breakaway?
Another pair that may remain of interest on the short-side of the Greenback is EUR/USD. The European Central Bank has been similarly dovish of late, pledging the possibility of yet another rate cut at their September meeting and, perhaps even, the potential for another round of QE at some point in the not-too-distant future. But more rate cuts don’t really come as much of a surprise from the ECB as the bank has been very dovish for practically the entire tenure of Mario Draghi. The quick shuffling in US rate expectations lower has helped to buoy EUR/USD above the 1.1000 level.
The past week, in particular, has been showing a lack of direction as price action remains bound to a support/resistance zone that’s been in-play for the past nine months. This runs from 1.1187-1.1212 and is bound by two different longer-term Fibonacci levels.
And even despite the seemingly negative backdrop surrounding Europe, where more political drama may soon be around-the-corner, the potential for a short squeeze scenario remains as the pair really hasn’t put in much of a recovery since starting to slalom lower more than a year ago.
EUR/USD Daily Price Chart
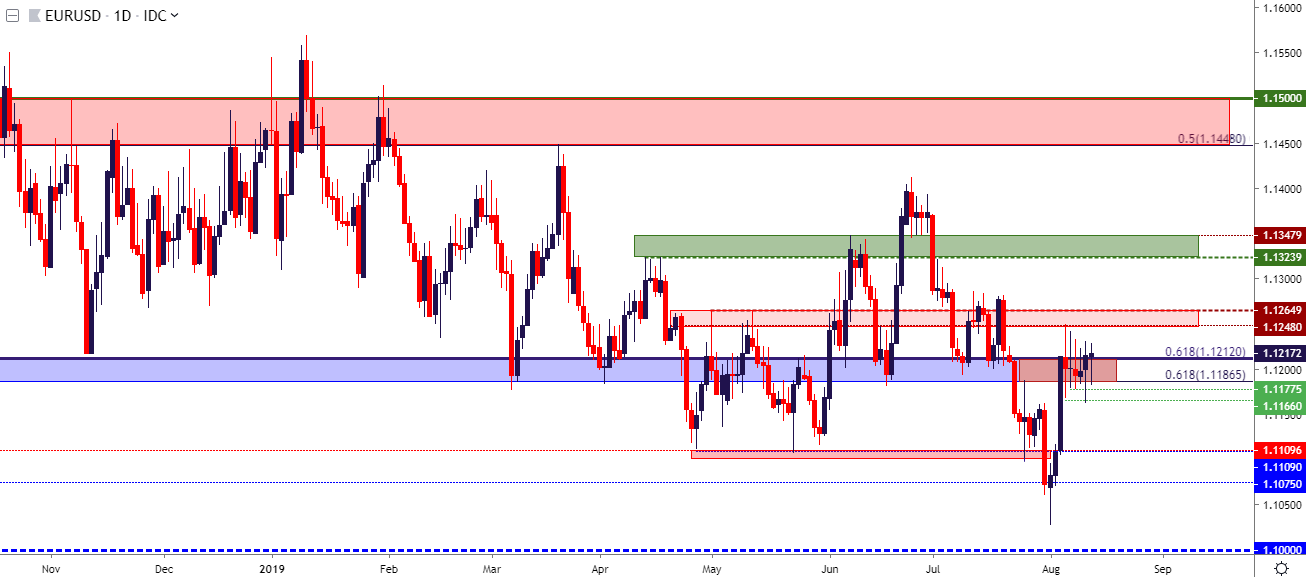
Chart prepared by James Stanley; EURUSD on Tradingview
USD/CAD May Soon Bring Bearish Interest
In the still developing camp of potential USD-weakness scenarios, USD/CAD may soon become of interest. The pair was in a hard-bearish trend during June and the first-half of July, eventually finding support just above the 1.3000 handle. A bullish reversal then followed and that’s lasted pretty much ever since. Last week produced a short-term pullback to the 1.3200 level, and price have bounced from that support. The bit question around the pair at this point is whether we see seller defense of resistance at either last week’s high, or the resistance zone lurking just above that runs from 1.3361-1.3385.
USD/CAD Eight-Hour Price Chart

Chart prepared by James Stanley; USDCAD on Tradingview
To read more:
Are you looking for longer-term analysis on the U.S. Dollar? Our DailyFX Forecasts have a section for each major currency, and we also offer a plethora of resources on Gold or USD-pairs such as EUR/USD, GBP/USD, USD/JPY, AUD/USD. Traders can also stay up with near-term positioning via our IG Client Sentiment Indicator.
Forex Trading Resources
DailyFX offers an abundance of tools, indicators and resources to help traders. For those looking for trading ideas, our IG Client Sentiment shows the positioning of retail traders with actual live trades and positions. Our trading guides bring our DailyFX Quarterly Forecasts and our Top Trading Opportunities; and our real-time news feed has intra-day interactions from the DailyFX team. And if you’re looking for real-time analysis, our DailyFX Webinars offer numerous sessions each week in which you can see how and why we’re looking at what we’re looking at.
If you’re looking for educational information, our New to FX guide is there to help new(er) traders while our Traits of Successful Traders research is built to help sharpen the skill set by focusing on risk and trade management.
--- Written by James Stanley, Strategist for DailyFX.com
Contact and follow James on Twitter: @JStanleyFX


