


Global stock markets are hitting on important support levels and this has them at least positioned for an oversold bounce, but how the retracement unfolds will help determine whether more weakness is to follow. Crude oil is in a precarious position right here, especially the Brent contract. Gold is launching into 2013 levels, a pullback to support may offer traders a nice dip opportunity.
Technical Highlights:
- Dow Jones, DAX hit important support levels
- Crude oil continues to look vulnerable
- Gold price strong, watching for pullback to support
Make more informed decisions by checking out our trading forecasts and educational resources on the DailyFX Trading Guides page.
Dow Jones, DAX hit important support levels
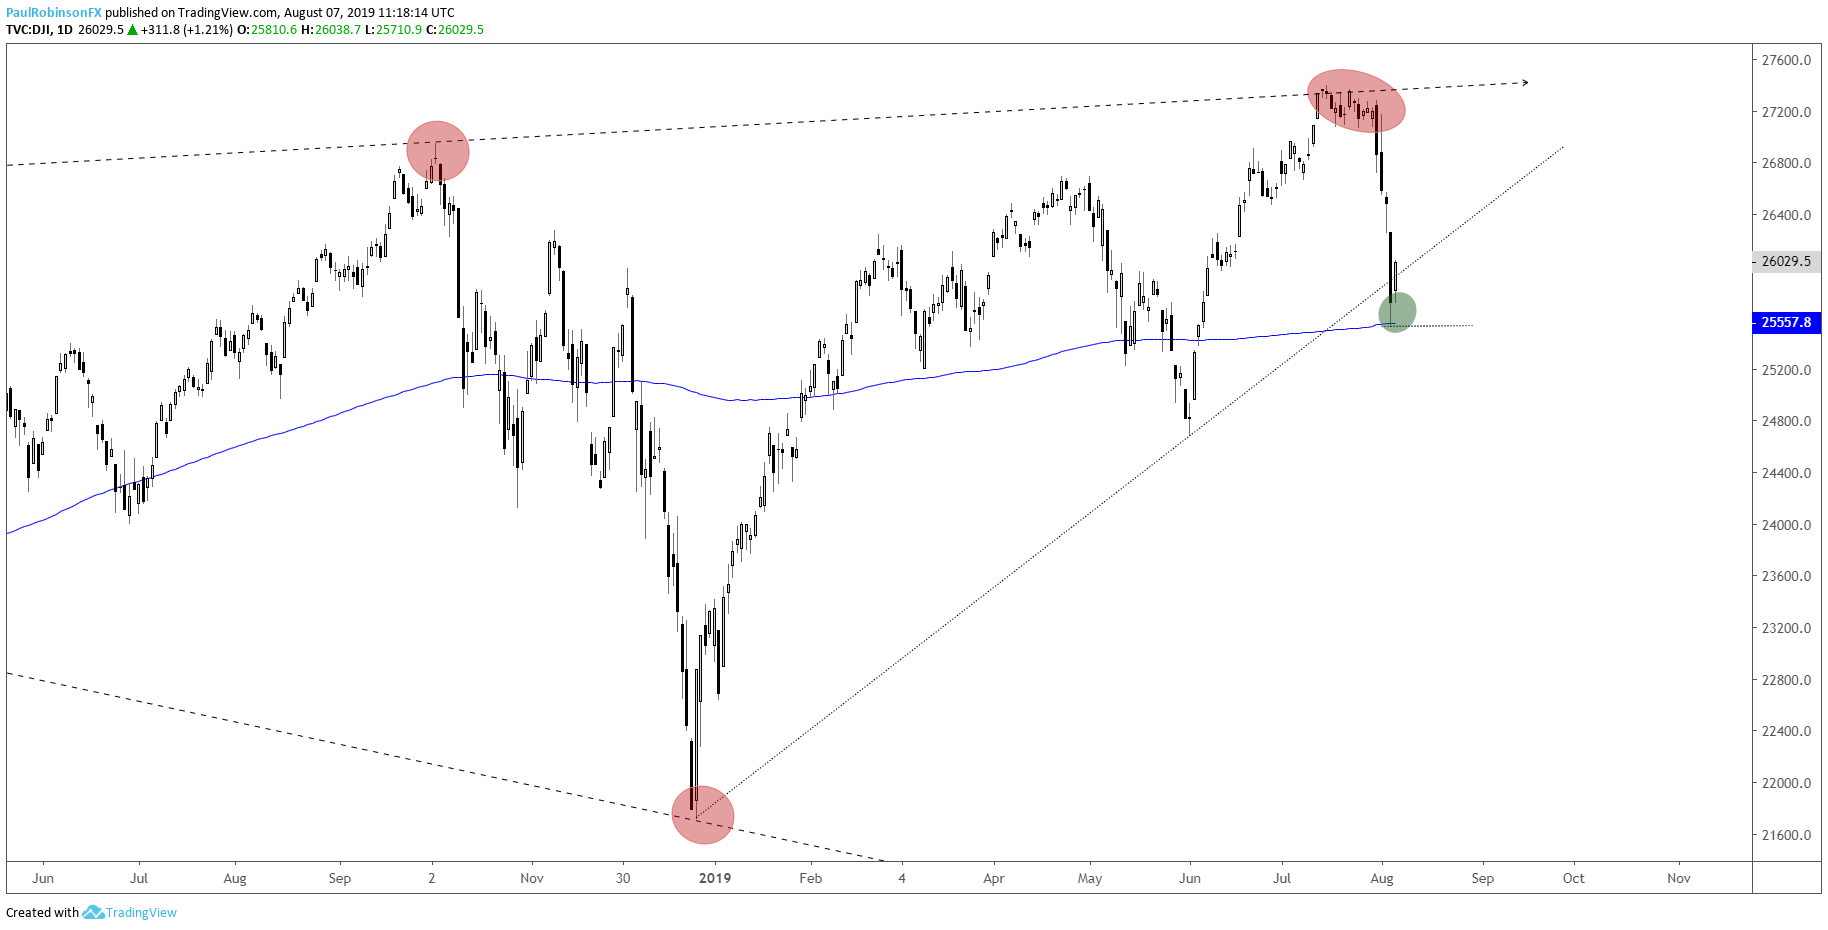
The Dow Jones tagged the 200-day on Monday, which is so far helping give it a boost. How the rally plays out could be quite telling in the days ahead. A sloppy bounce marked by a lot of overlapping price action or a quick jab higher and immediate failure will suggest it is only a correction and have another sell-off in focus.
Dow Jones Daily Chart (coming off 200-day)
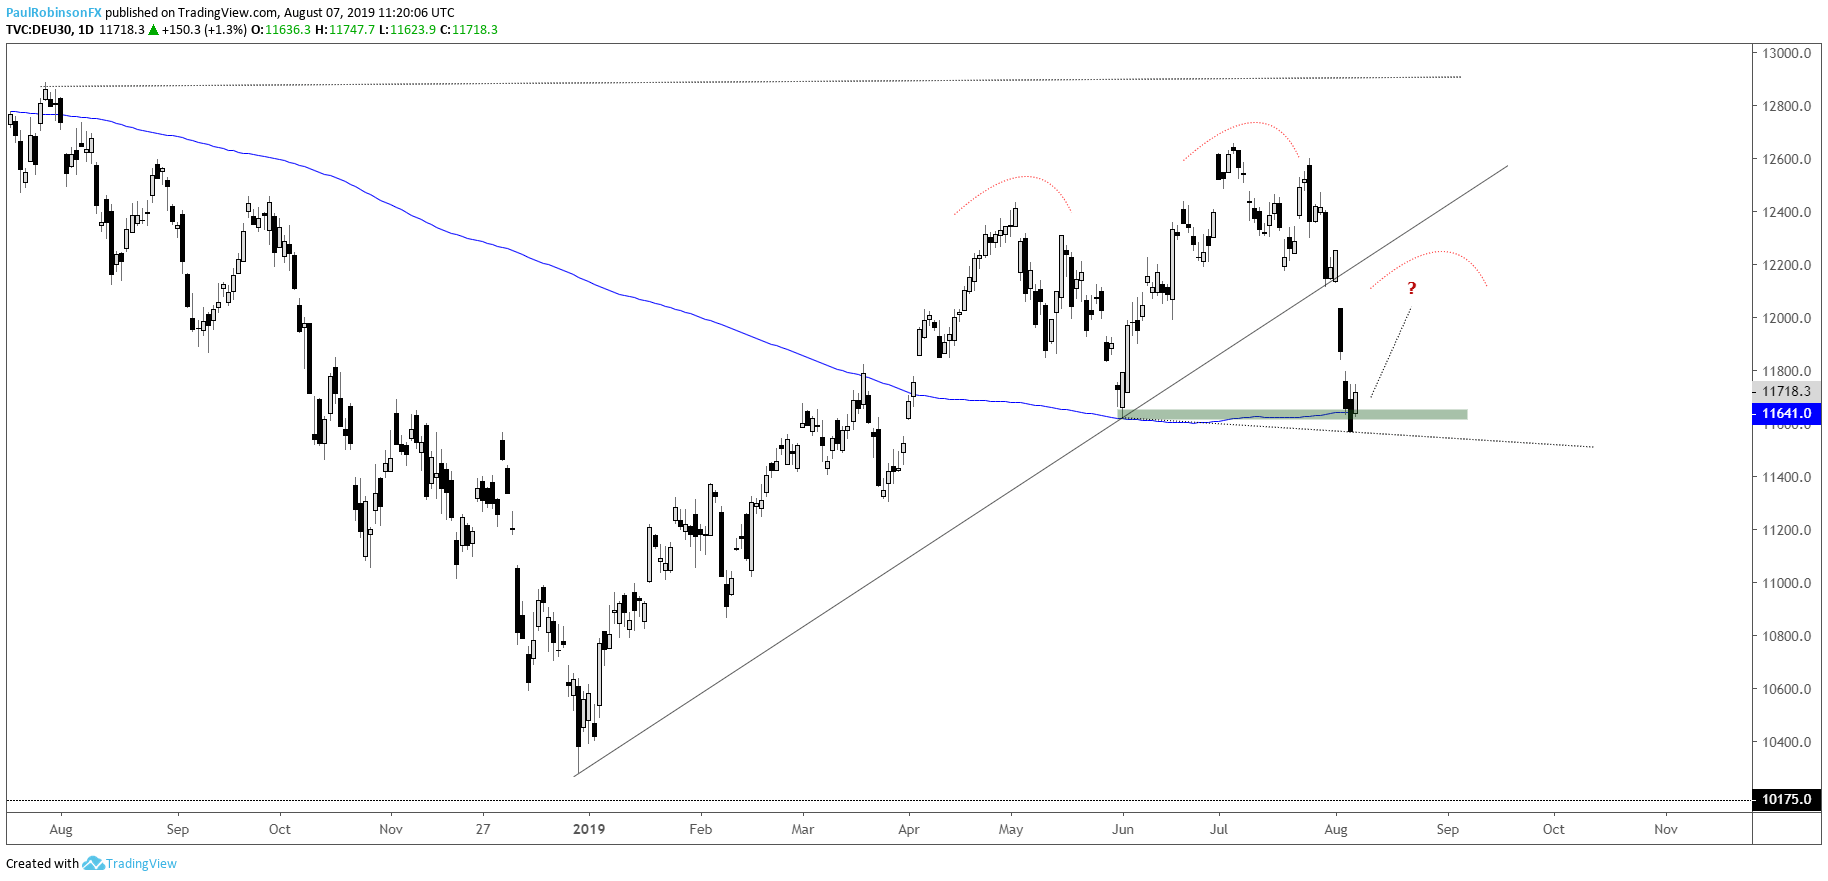
The DAX also hit its 200-day, actually closed just below it yesterday along with support from early June. A bounce from here could help bring life into a head-and-shoulders pattern, but that is only a loose scenario at the moment; first need to bounce and then fail back through the neckline for it to come fully to life. For now, a bounce at the least looks likely.
DAX Daily Chart (coming from just beneath support
Crude oil continues to look vulnerable
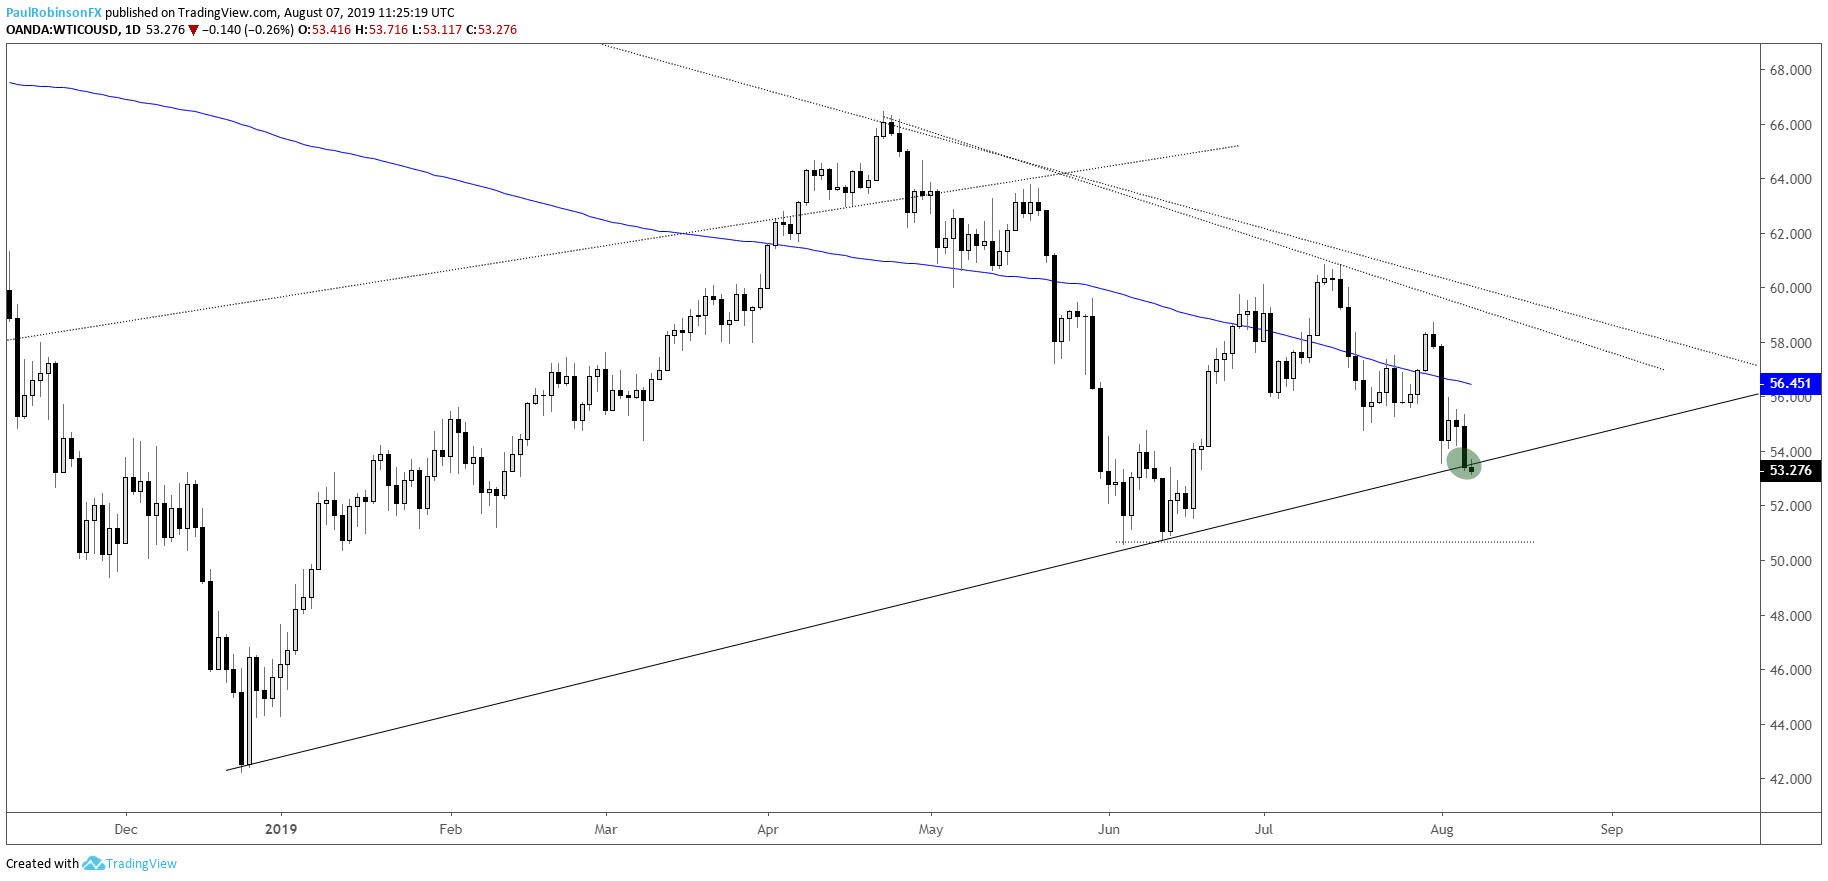
The WTI contract is hanging precariously on the trend-line from the December low. A break below will have in focus the June low near 50.50, where it made a small double-bottom.
WTI Crude oil Chart (December trend-line at risk of breaking soon)
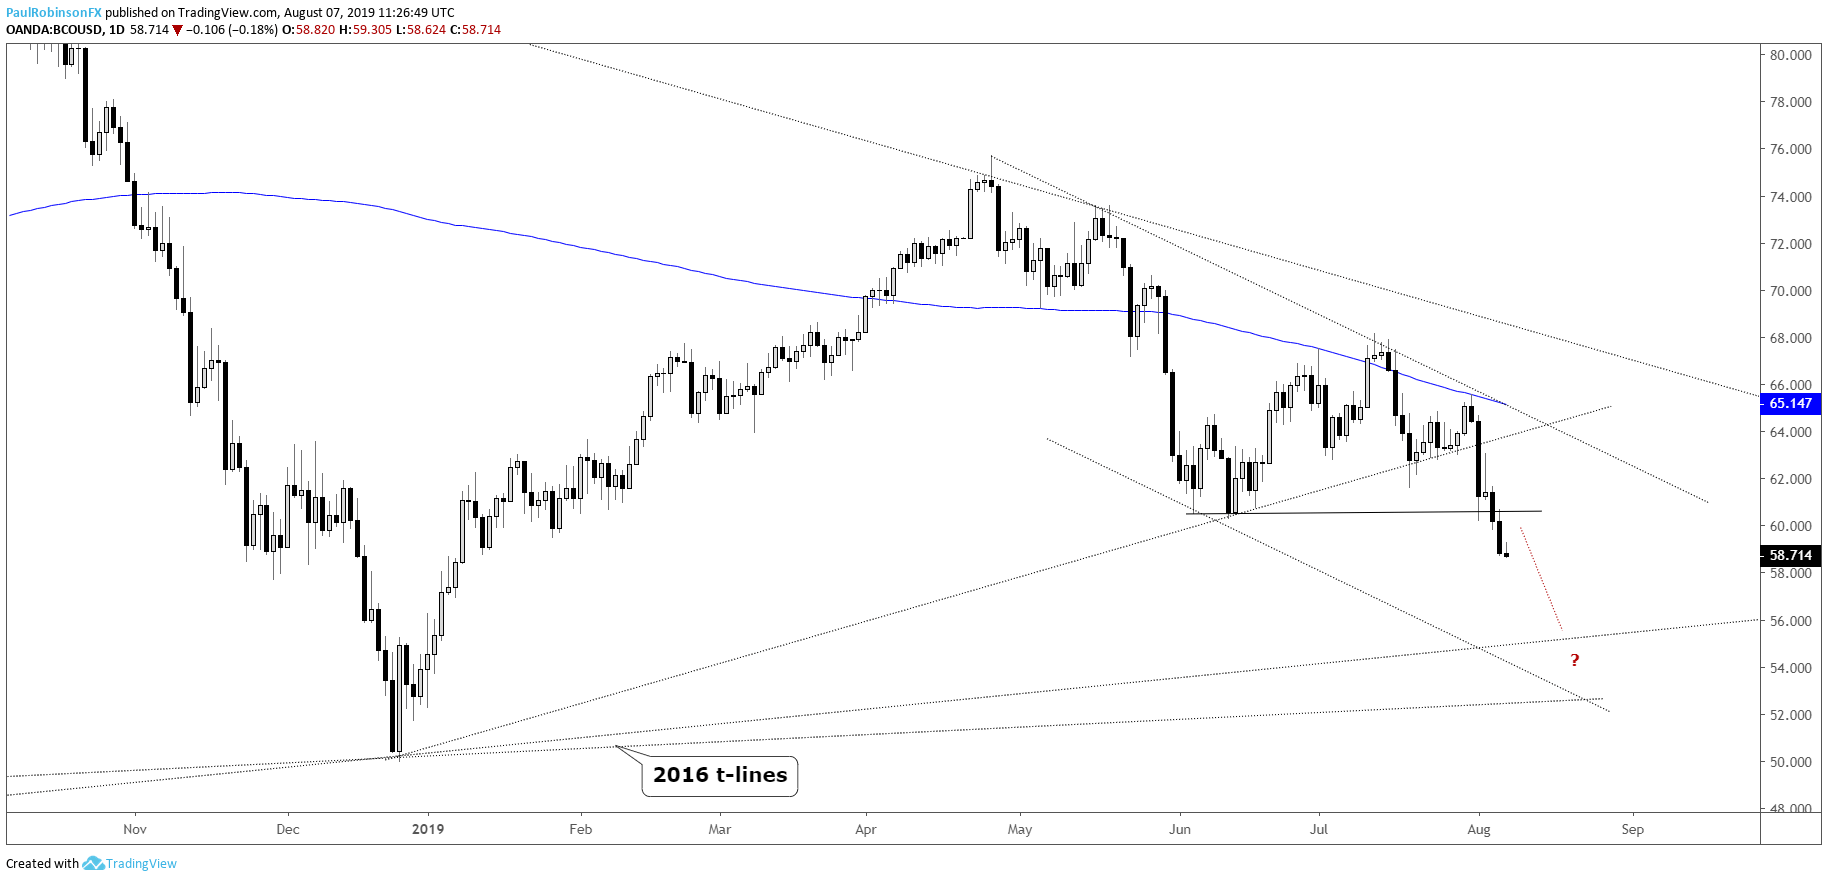
Brent crude is weaker than WTI, already trading below the December trend-line and June low. Continued weakness will have trend-lines from 2016 in focus near the mid to lower-50s.
Brent Crude oil Chart (2016 t-lines next?)
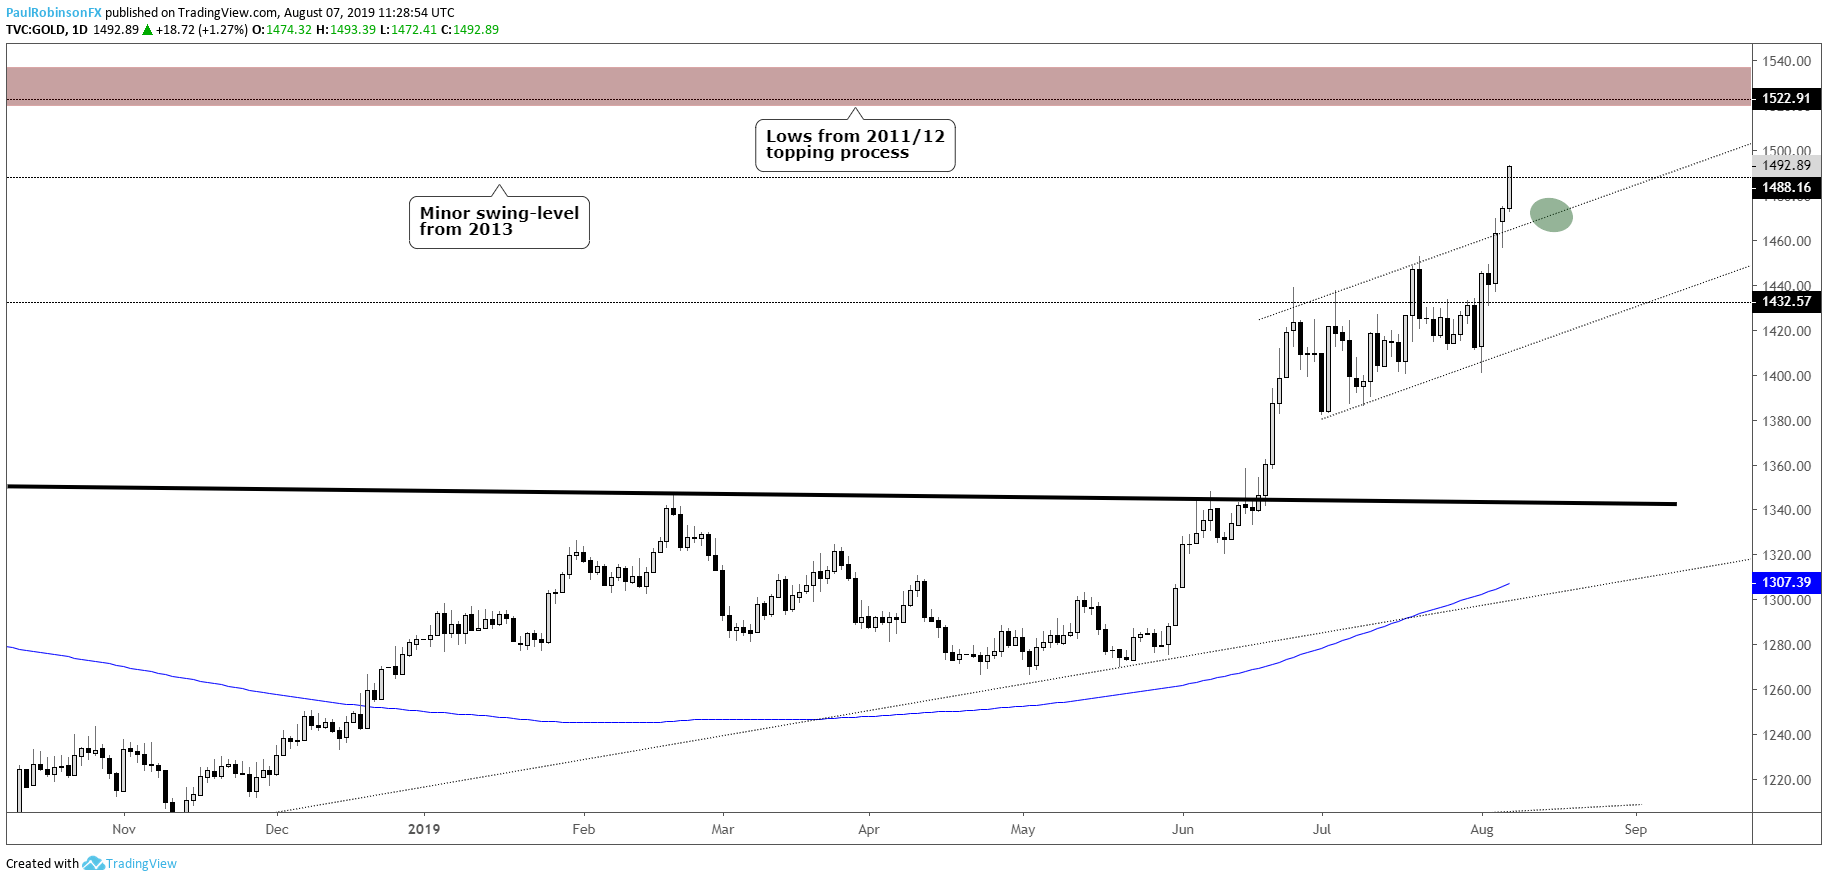
Gold price strong, watching for pullback to support
Gold broke out above the upper parallel yesterday, positioning it for higher prices. A solid pullback opportunity could soon arise with a decline to the upper parallel. A hold of this once resistance turned support could set up well for taking advantage of a move to the lows from 2011/12 in the 1520/40s region.
Gold Price Chart (watch pullback to support)
Resources for Index & Commodity Traders
Whether you are a new or an experienced trader, DailyFX has several resources available to help you; indicator for tracking trader sentiment, quarterly trading forecasts, analytical and educational webinars held daily, and trading guides to help you improve trading performance.
We also have a series of guides for those looking to trade specific markets, such as the S&P 500, Dow, DAX, gold, silver, crude oil, and copper.
---Written by Paul Robinson, Market Analyst
You can follow Paul on Twitter at @PaulRobinsonFX


