


The Dow Jones is turning towards a breakout but still need to be mindful of a longer-term top-side trend-line that could prove problematic. The DAX is also positioned for higher prices as the pullback proved constructive. Turning to gold, it is holding onto support but precariously so; keep any eye on how it plays out next day or so as it could be of high importance for the foreseeable future.
Technical Highlights:
- Dow Jones acting well, but watch longer-term top-side t-line
- DAX broke out from healthy pullback formation
- Gold is trying to up from support, next few days could be important
Make more informed decisions by checking out our trading forecasts and educational resources on the DailyFX Trading Guides page.
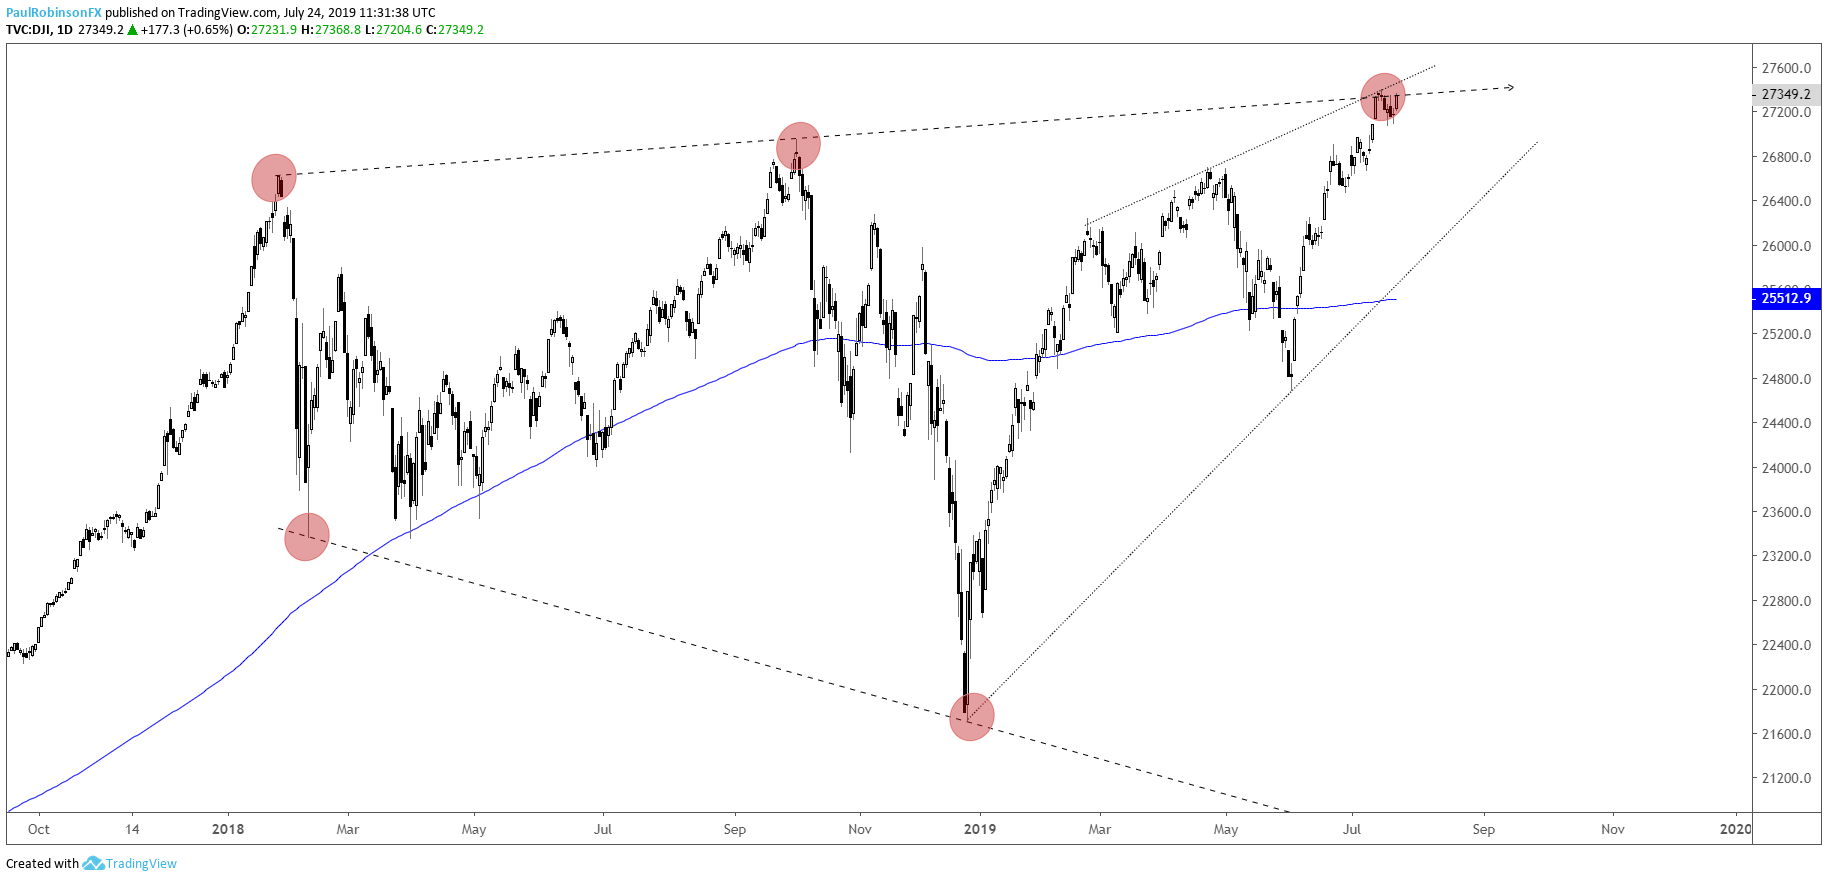
Dow Jones acting well, but watch longer-term top-side t-line
The Dow is holding up well so far, but has a meaningful top-side trend-line extending over from the January 2018 peak to contend with. The new high recently brings into play a long-term topping pattern known as a Reverse Symmetrical Triangle (RST) or Megaphone pattern (marked by higher-highs, lower-lows), but not meaningful for shorts until the near-term tone and trend align with it. For now, respecting the upward trend with one eye on potential for a major reversal.
Dow Jones Daily Chart (strong but at top-side t-line resistance)
DAX broke out from healthy pullback formation
The DAX had a nice, gradual pullback from the July high in play. Yesterday’s pop through the top-side of the bull-flag pattern sets into motion a move to the monthly high at 12656. Should at least get to that point, with a new high seen as having a good likelihood. Keep in mind tomorrow is the ECB meeting and it could get interesting, so be mindful of how this may impact current positions and/or ideas.
DAX Daily Chart (looking for new highs soon…)

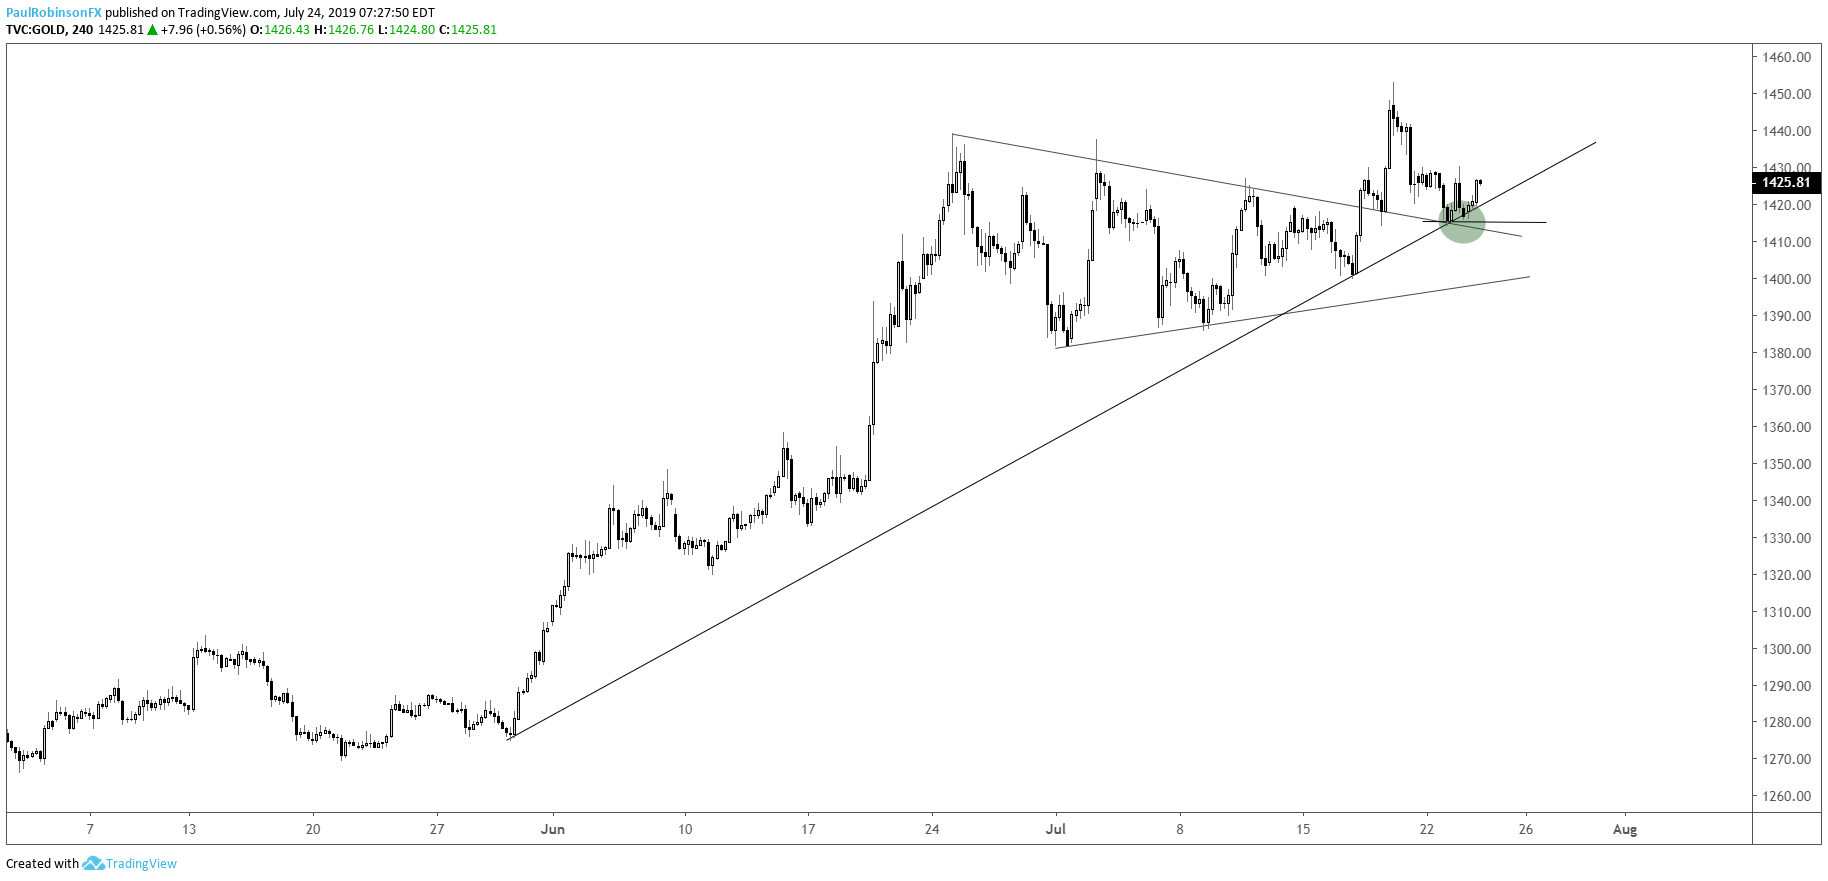
Gold is trying to up from support, next few days could be important
Gold is at a meaningful spot given it is testing the recent triangle breakout and trend-line from late-May. A hold here will keep it aimed upward. However, a break below the under-side trend-line of the pattern would make for a failed pattern and those can lead to strong reversals as buyers are caught leaning the wrong way. For now, giving support and trend the benefit of the doubt before thinking about a reversal event.
Gold Price 4-hr Chart (at confluence of support)
Resources for Index & Commodity Traders
Whether you are a new or an experienced trader, DailyFX has several resources available to help you; indicator for tracking trader sentiment, quarterly trading forecasts, analytical and educational webinars held daily, and trading guides to help you improve trading performance.
We also have a series of guides for those looking to trade specific markets, such as the S&P 500, Dow, DAX, gold, silver, crude oil, and copper.
---Written by Paul Robinson, Market Analyst
You can follow Paul on Twitter at @PaulRobinsonFX


