


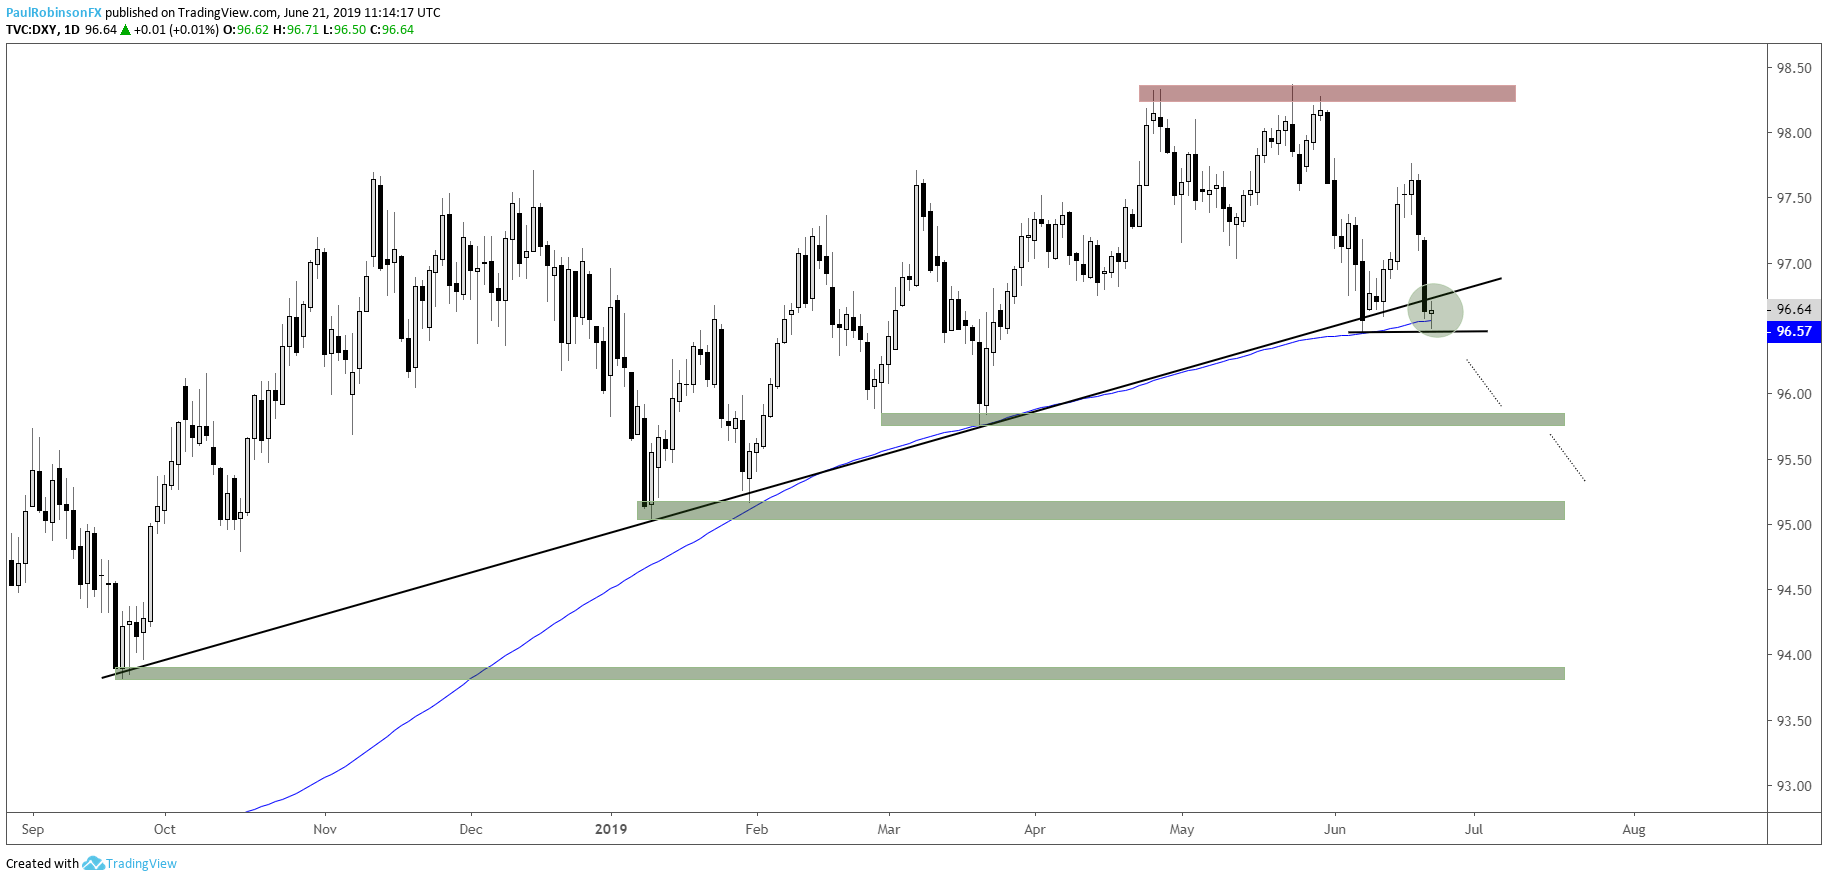
In today’s webinar, we looked at a big line-in-the-sand for the U.S. Dollar Index (DXY), and how a break of it could lead to a sizable down-move. With that, the Euro will of course be the most important player as it is the biggest constituent in the index. We looked a few cross-rate set-ups including but not limited to EURGBP, CHFJPY, and GBPAUD.
US Dollar (DXY) Daily Chart
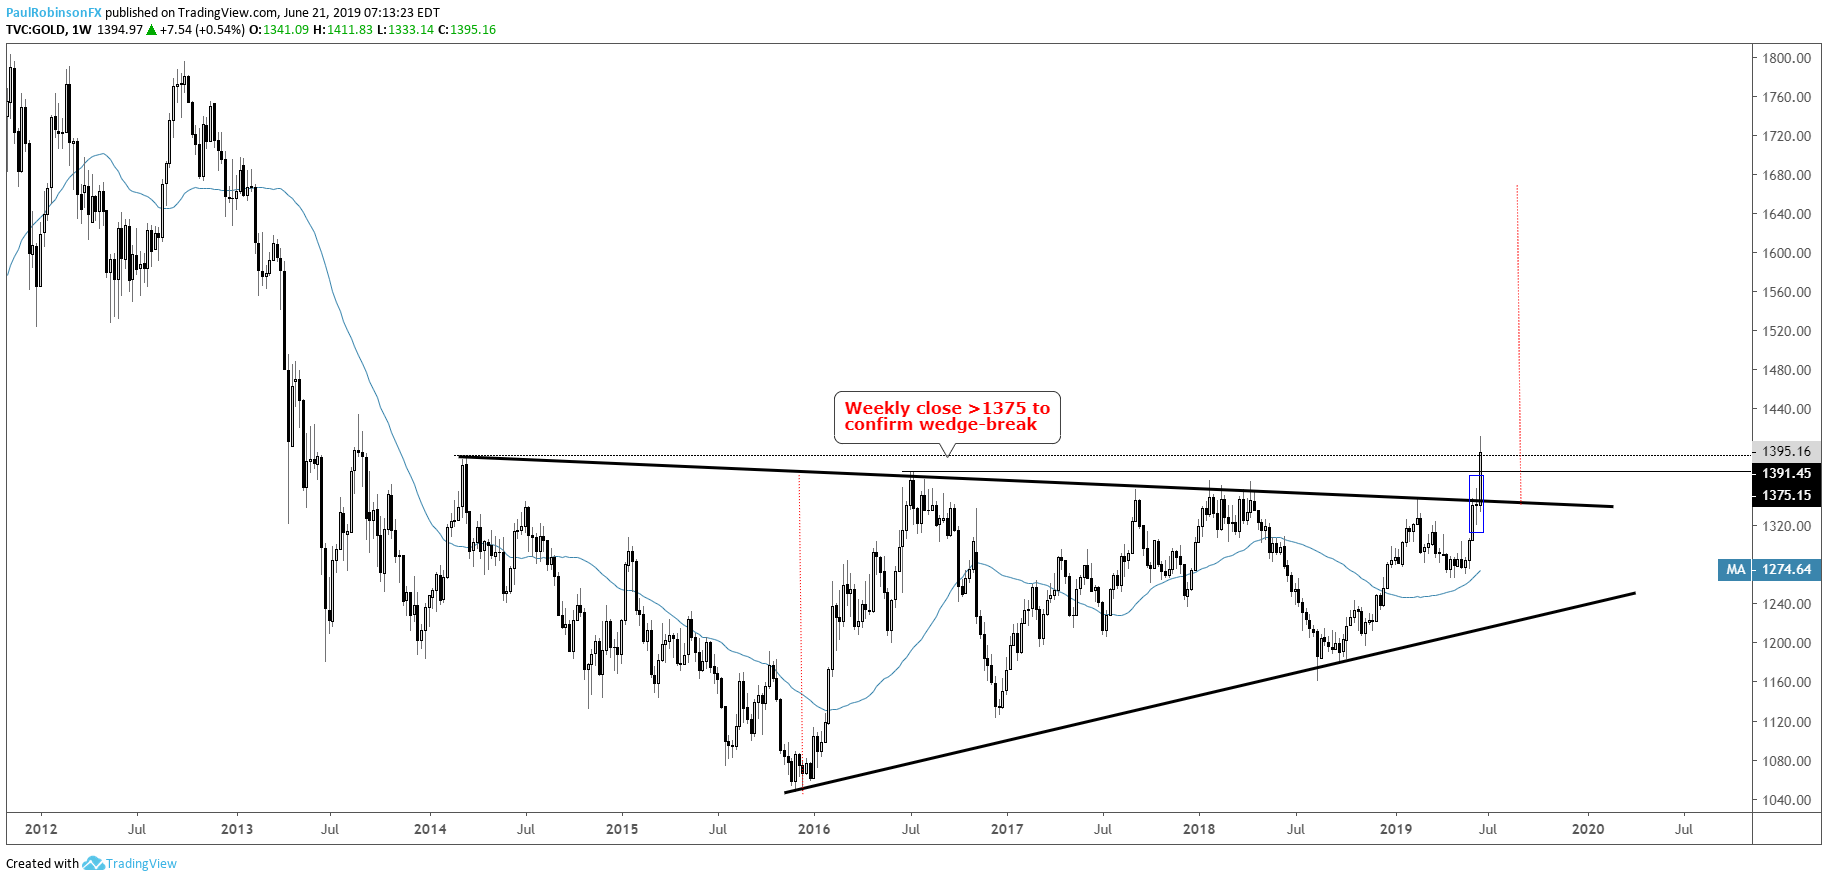
Gold price is currently above the 1375 breakout threshold I’ve had penciled in as important to confirm a move higher out of the massive multi-year wedge it’s been stuck in. We may see some testing next week of the breakout, which could offer traders an opportunity to establish bullish set-ups as long as support holds.
Gold Price Weekly Chart
For the full discussion, check out the video above.
Resources for Forex & CFD Traders
Whether you are a new or an experienced trader, DailyFX has several resources available to help you; indicator for tracking trader sentiment, quarterly trading forecasts, analytical and educational webinars held daily, trading guides to help you improve trading performance, and one specifically for those who are new to forex.
---Written by Paul Robinson, Market Analyst
You can follow Paul on Twitter at @PaulRobinsonFX


