


FX Price Action Setups in EUR/USD, USD/JPY and USD/CHF
It’s been a busy start to 2019 so far, and the one-two combo of last Friday’s strong NFP report followed by FOMC Chair Jerome Powell’s speech has helped to pull market participants back from the ledge. This followed a troubling start to the New Year after the Japanese Yen ‘melt up’ in the first few trading days of 2019. As discussed in this week’s Technical Forecast for Equities, this could provide a backdrop for continued recovery with the prospect of a 24k re-test in the Dow Jones Industrial Average. On the currency side of the matter, the US Dollar has posed a re-test of the two-month lows which, at this point, continue to hold. But this can keep interest on the short-side of the US currency after another bearish driver appeared with the softened stance from FOMC Chair Jerome Powell.
There remains some headline risk on the economic calendar for this week: Tonight at 9PM ET is President Trump’s first Oval Office Address, and there’s likely something provocative planned; markets don’t yet know what that might be. Tomorrow brings a Bank of Canada rate decision followed by FOMC meeting minutes from the December rate hike. Tomorrow at Noon ET brings another speech from FOMC Chair, Jerome Powell, and this will likely catch considerable attention across global markets. And then Friday morning brings US CPI numbers for the month of December.
Forex Talking Points:
- If you’re looking to improve your trading approach, our Traits of Successful Traders research could help. This is based on research derived from actual results from real traders, and this is available to any trader completely free-of-charge.
- If you’re looking for a primer on the FX market, we can help. To get a ground-up explanation behind the Forex market, please click here to access our New to FX Trading Guide.
If you’d like to sign up for our webinars, we host an event on Tuesday and Thursday, each of which can be accessed from the below links:
Tuesday: Tuesday, 1PM ET
Thursday: Thursday 1PM ET
Dow Softens from Resistance After Bulls Hold Support at Prior Confluent Res
US equities have continued to claw back Q4 and December losses so far in the New Year, and that Friday price action produced an especially bullish day in US indices. That strength has largely held into this week, with support showing up at a key area on the Dow around yesterday’s open. That level takes place around a confluent spot on the chart at 23,300, and this is the most recent swing-low. This can complicate bullish setups at the moment given how far away it is from current prices; but as looked at in the webinar, a shorter-term chart can be used to plot support potential around the 23,500 area, which could make that a bit more of an attractive setup.
Dow Jones Four-Hour Price Chart
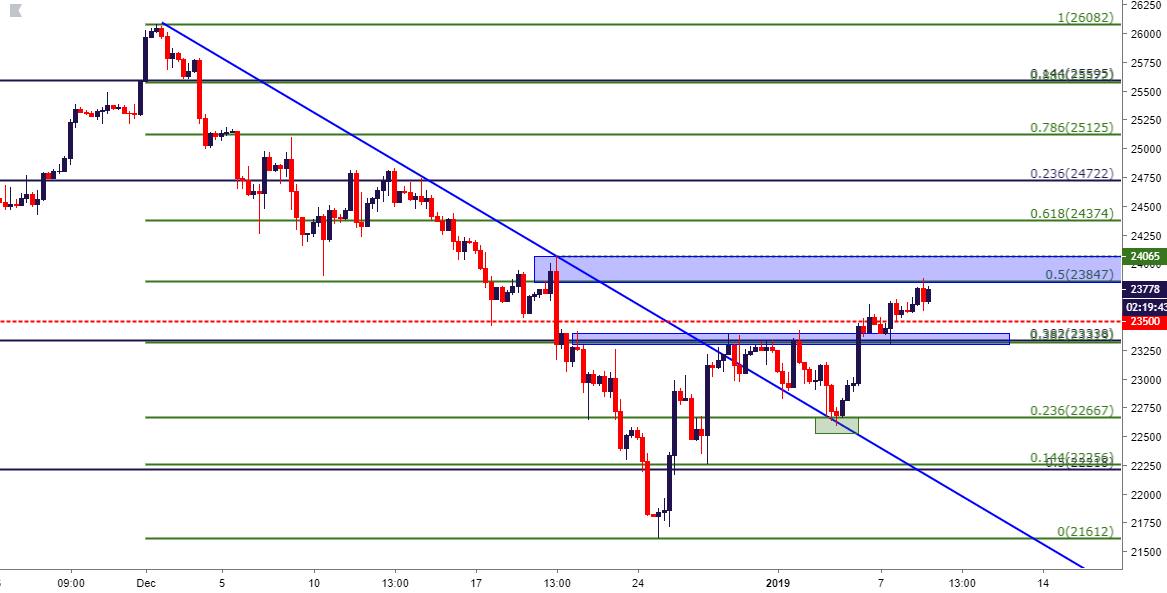
Chart prepared by James Stanley
US Dollar Holds Support at Two-Month-Lows
The US Dollar came into this week with a quick revisit to the two-month-low which, at this point, continues to hold support. Buyers haven’t yet been able to make much ground and this likely has to do with a lack of bullish drivers around the Euro at the moment, as EUR/USD remains confined below the big zone of resistance in that pair. In the US Dollar, I’m looking at a bearish bias with short-side targets around 95.50, 95.00 and then at the targets from the Q1 forecast at 94.20 and, big-picture, 92.00.
Short-term resistance could be sought out around Fibonacci levels at 96.04 and 96.47.
US Dollar Eight-Hour Price Chart
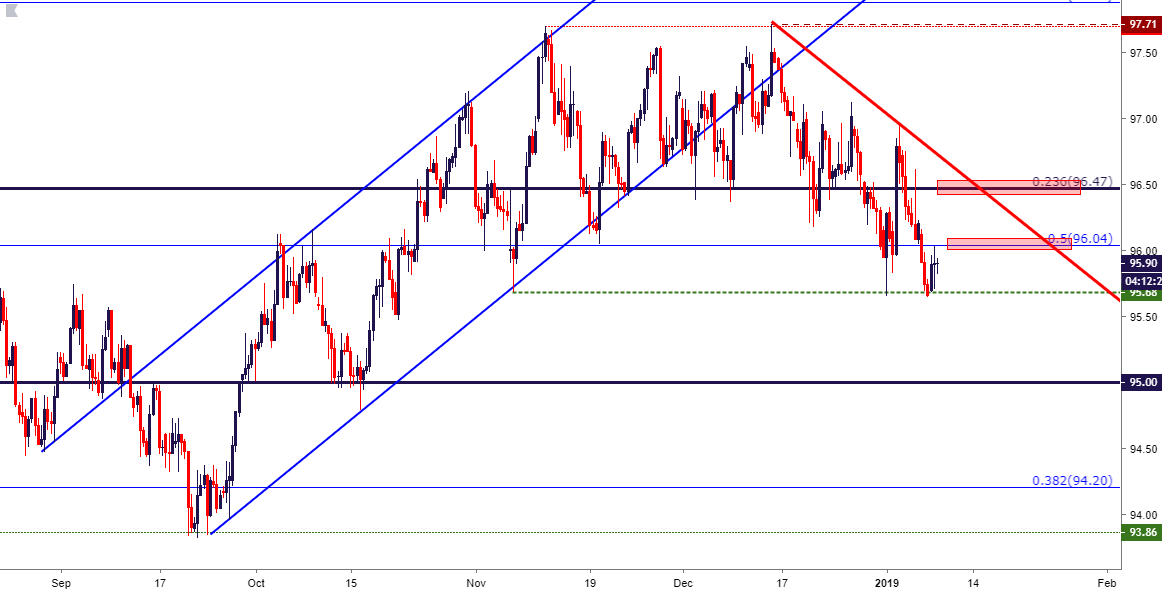
Chart prepared by James Stanley
EUR/USD Holds Key Resistance Zone, Bulls Showing at Higher-Lows
A bullish breakout may be in the cards for EUR/USD, as the pair has continued to probe around the big zone of resistance that rests from 1.1448-1.1500. This is combined with a series of higher-lows that have been coming in over the past month-and-change; and as discussed in FX Setups for this Week, a bullish break-above this zone could re-open the door for topside strategies in the pair.
In the webinar, I shared the ideal scenario of a topside breakout running up to 1.1550, at which point prices pullback to find support in this zone of prior resistance, around the psychological 1.1500 handle.
EUR/USD Eight-Hour Price Chart
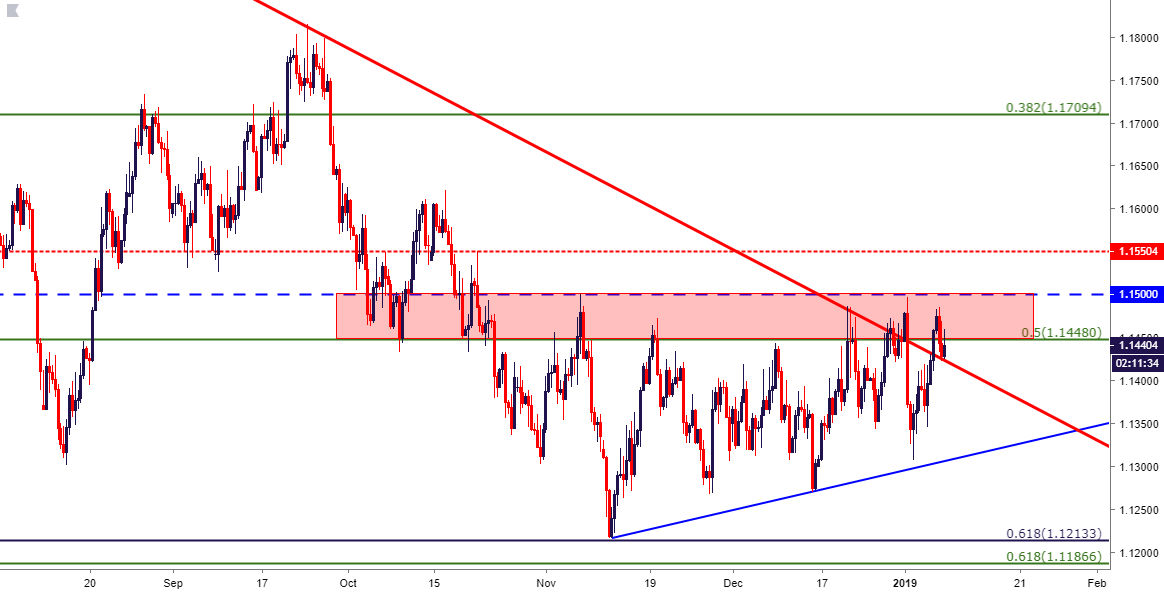
Chart prepared by James Stanley
GBP/USD Messy – Support Potential Around 1.2671
There’s little that’s certain around the British Pound at the moment. Next week brings the Brexit vote in UK Parliament, and it still looks very unlikely to pass; which brings on the potential for ‘Hard Brexit’ or ‘No Deal Brexit’ scenarios. What happens after that is very opaque, and for a currency that’s shown a general disdain for uncertainty, it can be difficult to muster much positivity around the matter.
Nonetheless, prices remain elevated after last week’s bounce. That prior area of resistance that came from the 23.6% retracement of the Brexit vote remains of interest, and prices finding support in this area can open the door for topside setups in the pair.
GBP/USD Four-Hour Price Chart
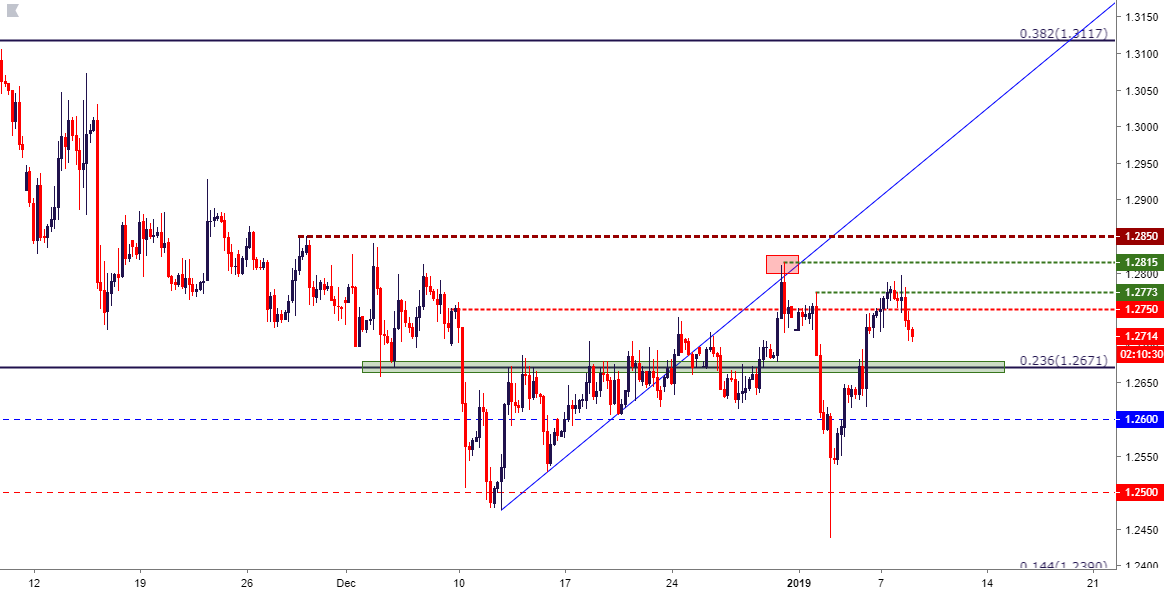
Chart prepared by James Stanley
USD/JPY Continues Recovery After Last Week’s ‘Melt Up’
On that tune of continued recovery, USD/JPY is showing higher-highs and higher-lows after last week’s brutal short-side move. The areas of resistance that I was looking at last week have turned into support, with buyers showing up around both 108.00 and again around 108.47, which is the 38.2% Fibonacci retracement of the November 2017 – March 2018 major move.
This keeps the door open for a deeper resistance test, targeting the 50% marker of that same major move, drawn up to the 110.00 psychological level. Alternatively, a down-side break below 107.89 could re-open the door for short-side momentum strategies should this current recovery come unraveled before deeper resistance came come into play.
USD/JPY Hourly Price Chart
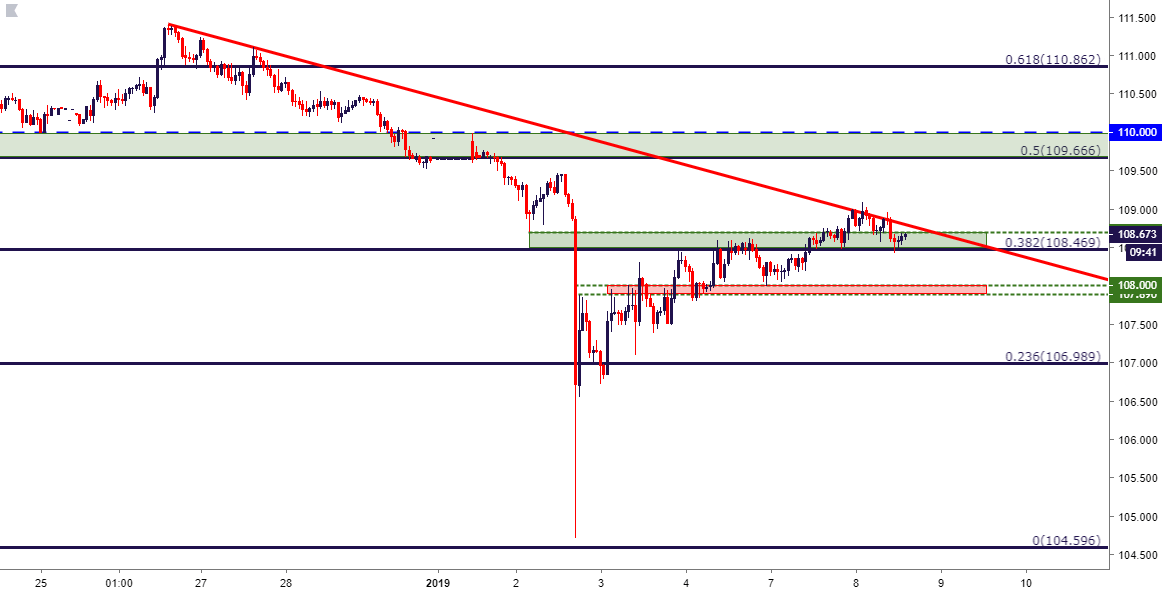
Chart prepared by James Stanley
USD/CHF Finds Support at .9800 – Where’s the Lower-High?
USD/CHF has been digging into support around the .9800 handle, and it’s become evident that bears might need another push before they can finally leave that level behind. This can open the door for a pullback to support at prior resistance, and there’s two areas of interest for such a theme: Around .9587 and again around .9902. A seller show of resistance at either of these zones re-opens the door for bearish strategies in the pair.
USD/CHF Four-Hour Price Chart
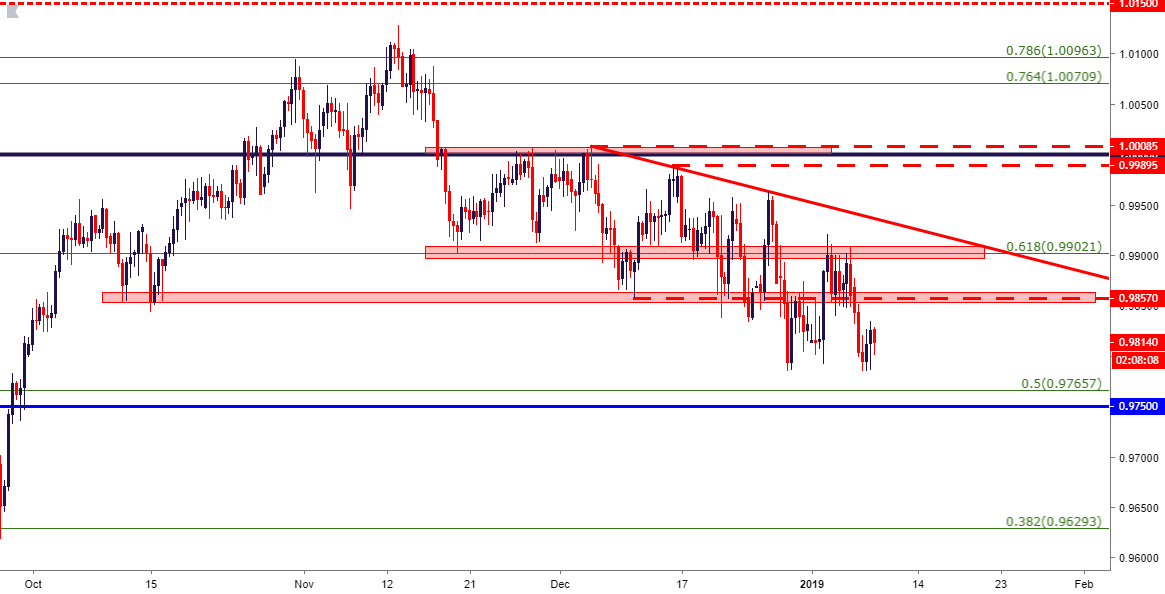
Chart prepared by James Stanley
USD/CAD Snaps Below Support Ahead of BoC
I looked at two different areas of support in USD/CAD last week; neither of which held, and this puts price action in a difficult spot for working with directional strategies. Tomorrow morning brings a Bank of Canada rate decision, and it may be more prudent to wait to see how that plays out before looking at exposure on either side of the pair. A revisit to resistance at one of those prior areas of potential support could open the door for bearish strategies.
USD/CAD Eight-Hour Price Chart
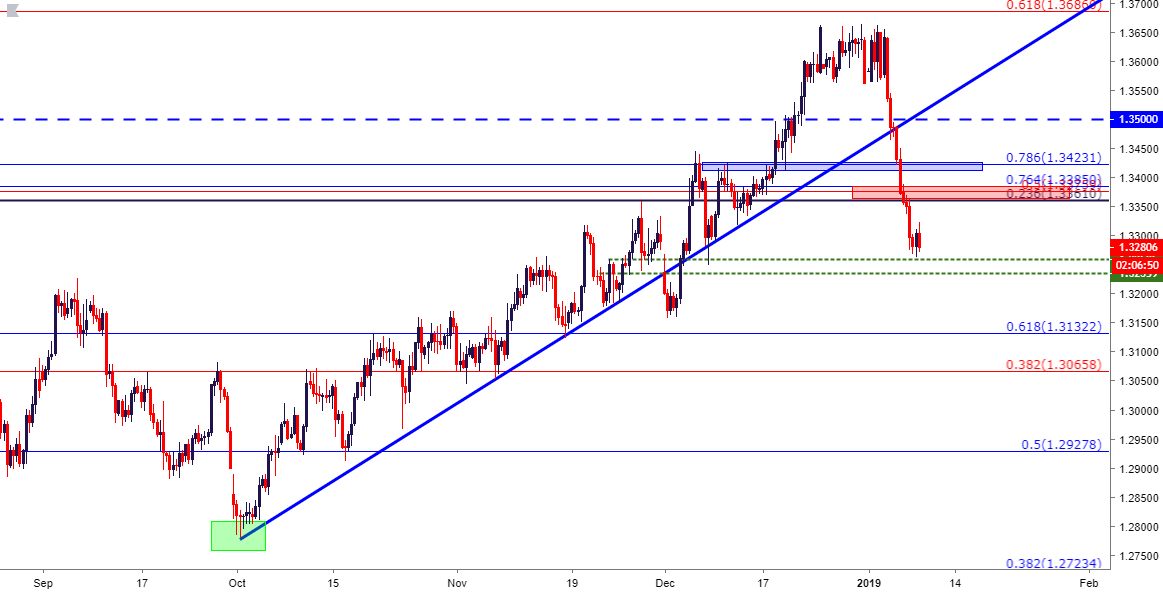
Chart prepared by James Stanley
AUD/USD Builds Range in Resistance Zone
Going along with recovery themes, AUD/USD has snapped back-above the .7000 level, and the last area of resistance potential that I was looking at last week has come into play. Sellers have shown resistance in this zone and this has helped to produce a short-term range. Prices tipping below that short-term range support can re-open the door to short-side strategies in the pair with stops investigated above this week’s swing-high.
AUD/USD Two-Hour Price Chart
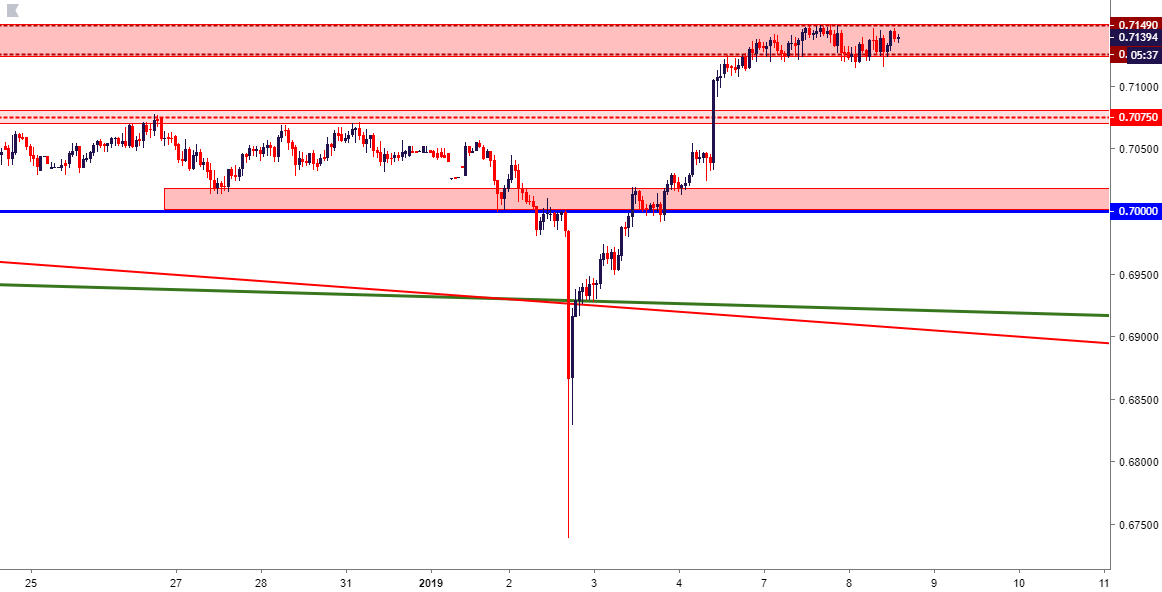
Chart prepared by James Stanley
To read more:
Are you looking for longer-term analysis on the U.S. Dollar? Our DailyFX Forecasts for Q1 have a section for each major currency, and we also offer a plethora of resources on USD-pairs such as EUR/USD, GBP/USD, USD/JPY, AUD/USD. Traders can also stay up with near-term positioning via our IG Client Sentiment Indicator.
Forex Trading Resources
DailyFX offers an abundance of tools, indicators and resources to help traders. For those looking for trading ideas, our IG Client Sentiment shows the positioning of retail traders with actual live trades and positions. Our trading guides bring our DailyFX Quarterly Forecasts and our Top Trading Opportunities; and our real-time news feed has intra-day interactions from the DailyFX team. And if you’re looking for real-time analysis, our DailyFX Webinars offer numerous sessions each week in which you can see how and why we’re looking at what we’re looking at.
If you’re looking for educational information, our New to FX guide is there to help new(er) traders while our Traits of Successful Traders research is built to help sharpen the skill set by focusing on risk and trade management.
--- Written by James Stanley, Strategist for DailyFX.com
Contact and follow James on Twitter: @JStanleyFX


