


The rout in the crude oil market has been impressively one-way with no reprieve for longs, and while oversold it has yet to give strong indications it wants to bounce. The price of gold is trapped between trend-line support and resistance, something soon may give as price continues to coil up. Global markets are in bounce-mode at the moment, but look for them to trade lower soon as the S&P 500 searches for early-year lows, the DAX tests or breaks the 2011 trend-line, and the FTSE continues to decline out of a macro topping pattern.
Technical Highlights:
- Crude oil deeply oversold, but still no buyers
- Gold price caught between a pair of opposing lines
- Global Indices bouncing but look headed for more weakness soon
See how traders are positioned in various markets/currencies and what it potentially tells us about future price fluctuations – IG Client Sentiment
Crude oil deeply oversold, but still no buyers
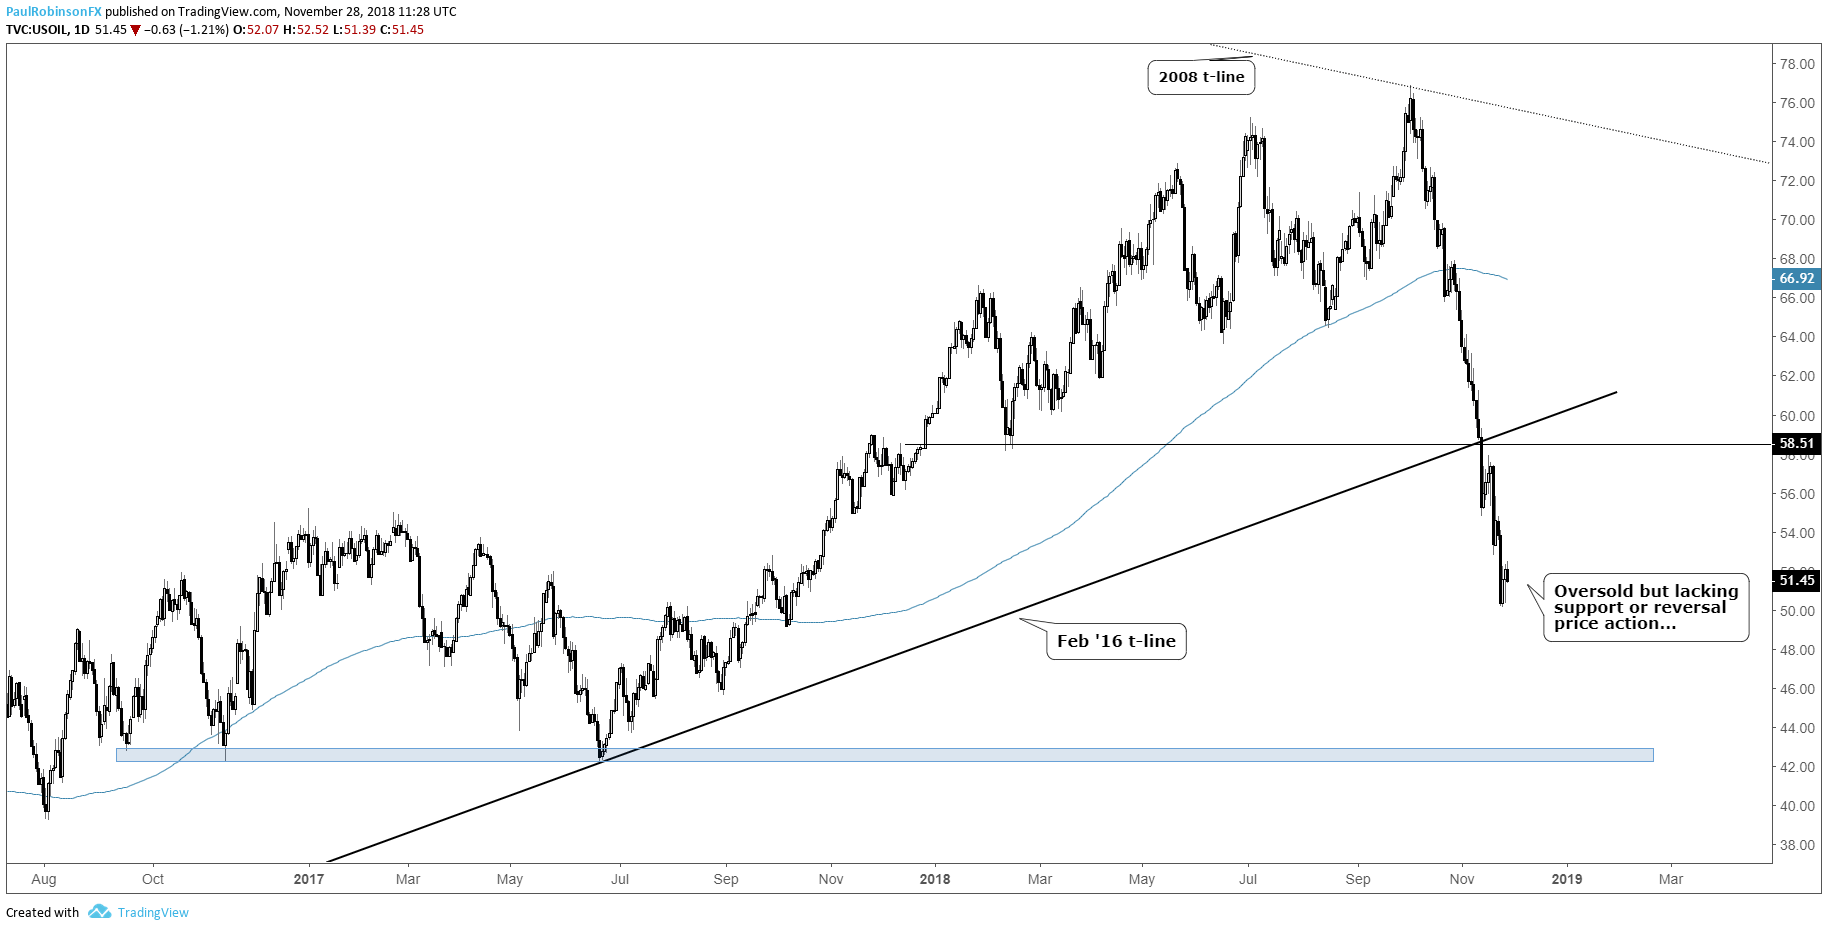
The decline has been spectacular and despite all 35% of losses so far coming in straight line fashion there has yet to be any reprieve for longs. And while oil is deeply oversold it is still lacking any meaningful technical levels to lean on, with the next area of major price support not arriving until close to 42.
It seems a bounce will likely occur before then, but perhaps instead of having a chance at playing any oversold bounce with an edge, we’ll be looking at an opportunity to sell a rally for a move towards lower prices. For now, risk/reward from either side of the tape isn’t appealing.
Crude Oil Daily Chart (Oversold but no support)
For the DailyFX intermediate-term fundamental and technical take, see the Q4 Crude Oil Forecast
Gold price caught between a pair of opposing lines
Gold has been a tough market to be a part of in recent months as a bear-flag continues to be on the build. In the more immediate future, there are trend-lines from April and August which are quickly coming to an intersection. This congestion of price is likely to lead to a breakout in price and momentum soon. Whether that will be the lower trend-line from August, or bottom line of the bear-flag, or higher above the April trend-line is to be seen.
In either case some momentum kicking in soon will be a welcomed event for traders. A break of the underside trend-line is seen as possibly kicking off another sizable leg lower in-line with the trend since the early-part of the year, while a break higher is viewed as continuing the development of a larger bear-flag.
Gold Daily Chart (Converging between opposing lines)

For the DailyFX intermediate-term fundamental and technical take, see the Q4 Gold Forecast
Global Indices bouncing but look headed for more weakness soon
S&P 500
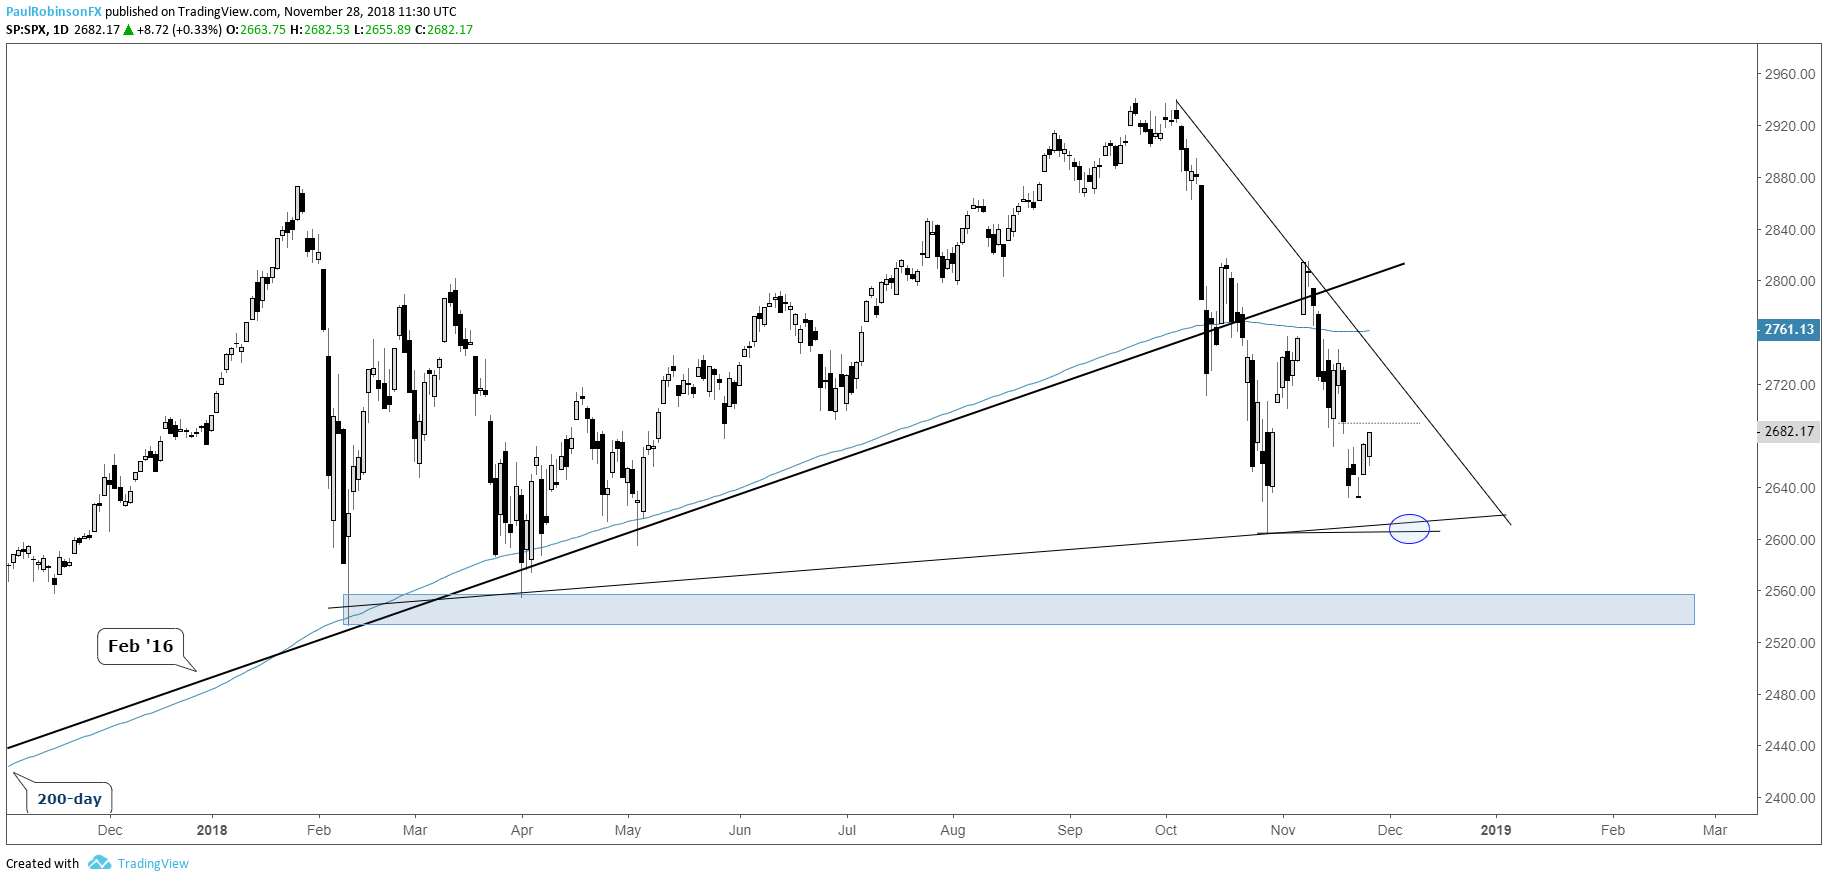
Global markets are in bounce-mode at the moment but the overall negative tone of the market is seen as continuing soon. The S&P 500 has a gap-fill coming soon 2690 and then trend-line resistance off the record high. A breakdown will have a low-angled trend-line from February in play along with the October low. The lows from early this year around 2553/32 remain targeted before a more sustainable bounce can get underway.
S&P 500 Daily Chart (Bounce to fail)
DAX 30
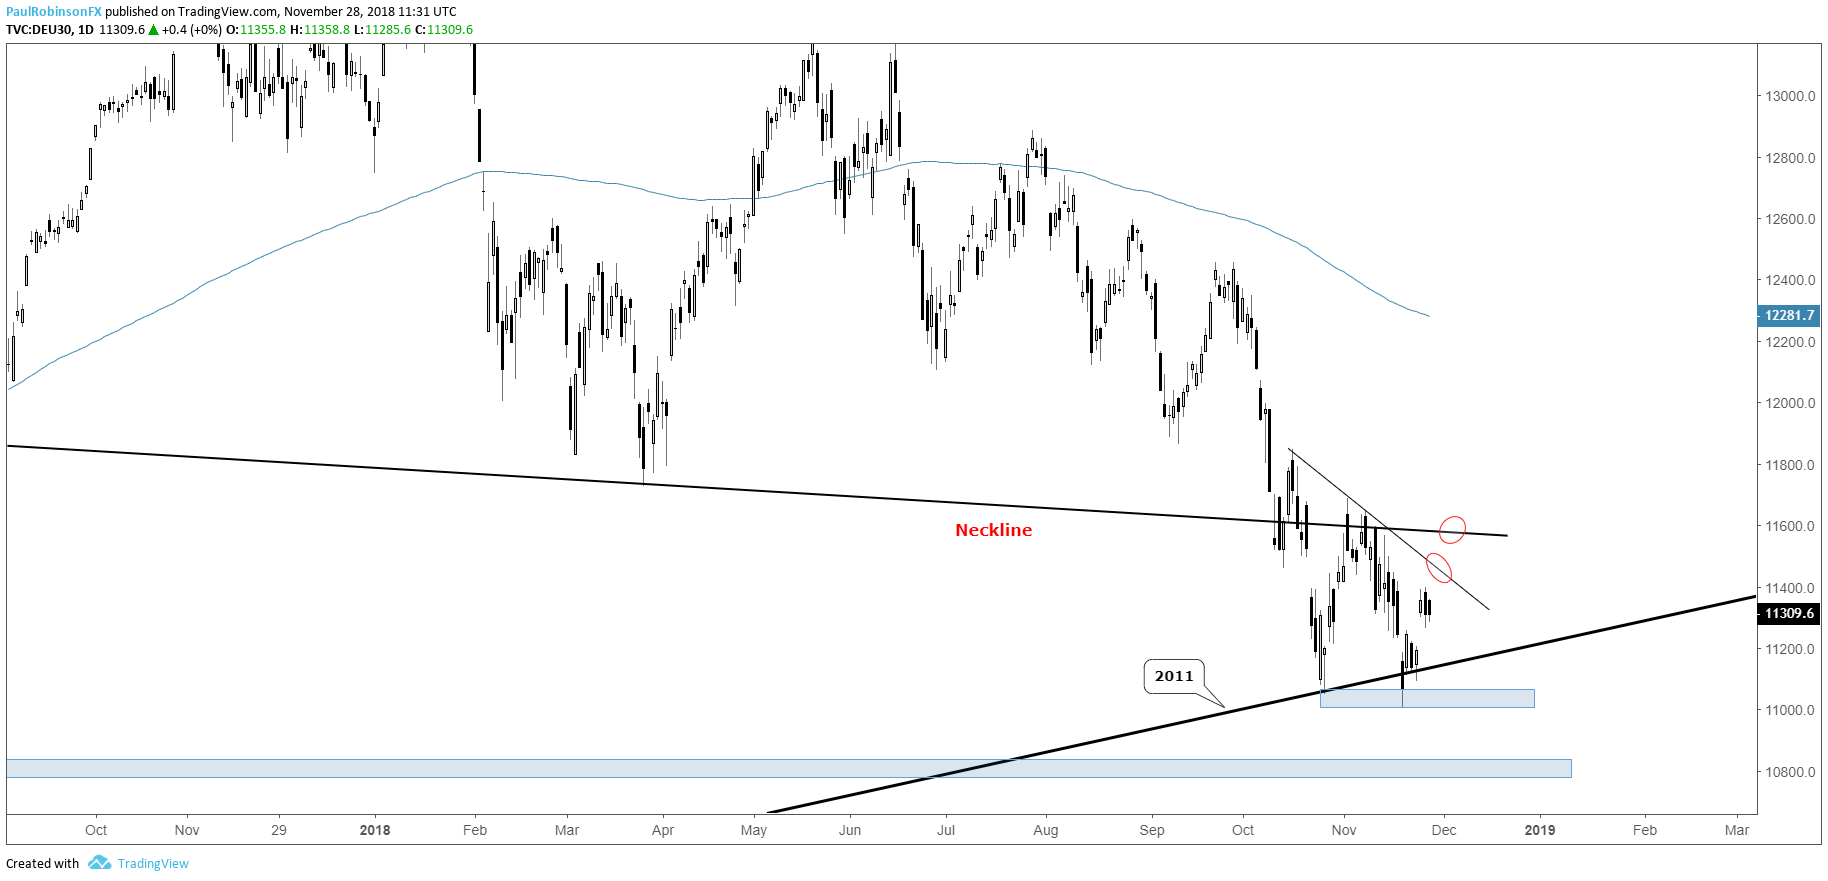
DAX is bouncing from the 2011 trend-line, but has resistance to contend with ahead. A turn down from a short-term trend-line or the neckline of the H&S pattern in play since June of last of year will once again have the long-term trend-line under pressure. The market may bounce around between these key thresholds, but overall the bias is for an eventual break much lower. For deeper insight, see this morning’s DAX commentary.
DAX Daily Chart (Between support/resistance)
FTSE 100
The FTSE bounce has been tepid and continues to remain vulnerable to another swing lower. Right now it is contending with a trend-line from late September but still support by lows in March and last month. Price action is getting wedged up between the two and may soon resolve with another leg lower. A confirmed weekly breakdown below the March low will kick-off the next leg of a long-term topping pattern with sub-6k targeted.
FTSE Daily Chart (Wedging on important support)

For the DailyFX intermediate-term fundamental and technical take, see the Q4 Global Equities Forecast
Resources for Index & Commodity Traders
Whether you are a new or an experienced trader, DailyFX has several resources available to help you; indicator for tracking trader sentiment, quarterly trading forecasts, analytical and educational webinars held daily, and trading guides to help you improve trading performance.
We also have a series of guides for those looking to trade specific markets, such as the S&P 500, Dow, DAX, gold, silver, crude oil, and copper.
---Written by Paul Robinson, Market Analyst
You can follow Paul on Twitter at @PaulRobinsonFX


