


DAX 30 Technical Highlights
- DAX bouncing off important long-term 2011 trend-line
- Resistance ahead should soon put a cap on further strength
- Long-term trend support may hold in near-term, but eventually break
For the intermediate-term fundamental and technical outlook for the DAX & Euro, check out the Q4 Trading Forecasts.
DAX bounce isn’t viewed as likely to last much longer
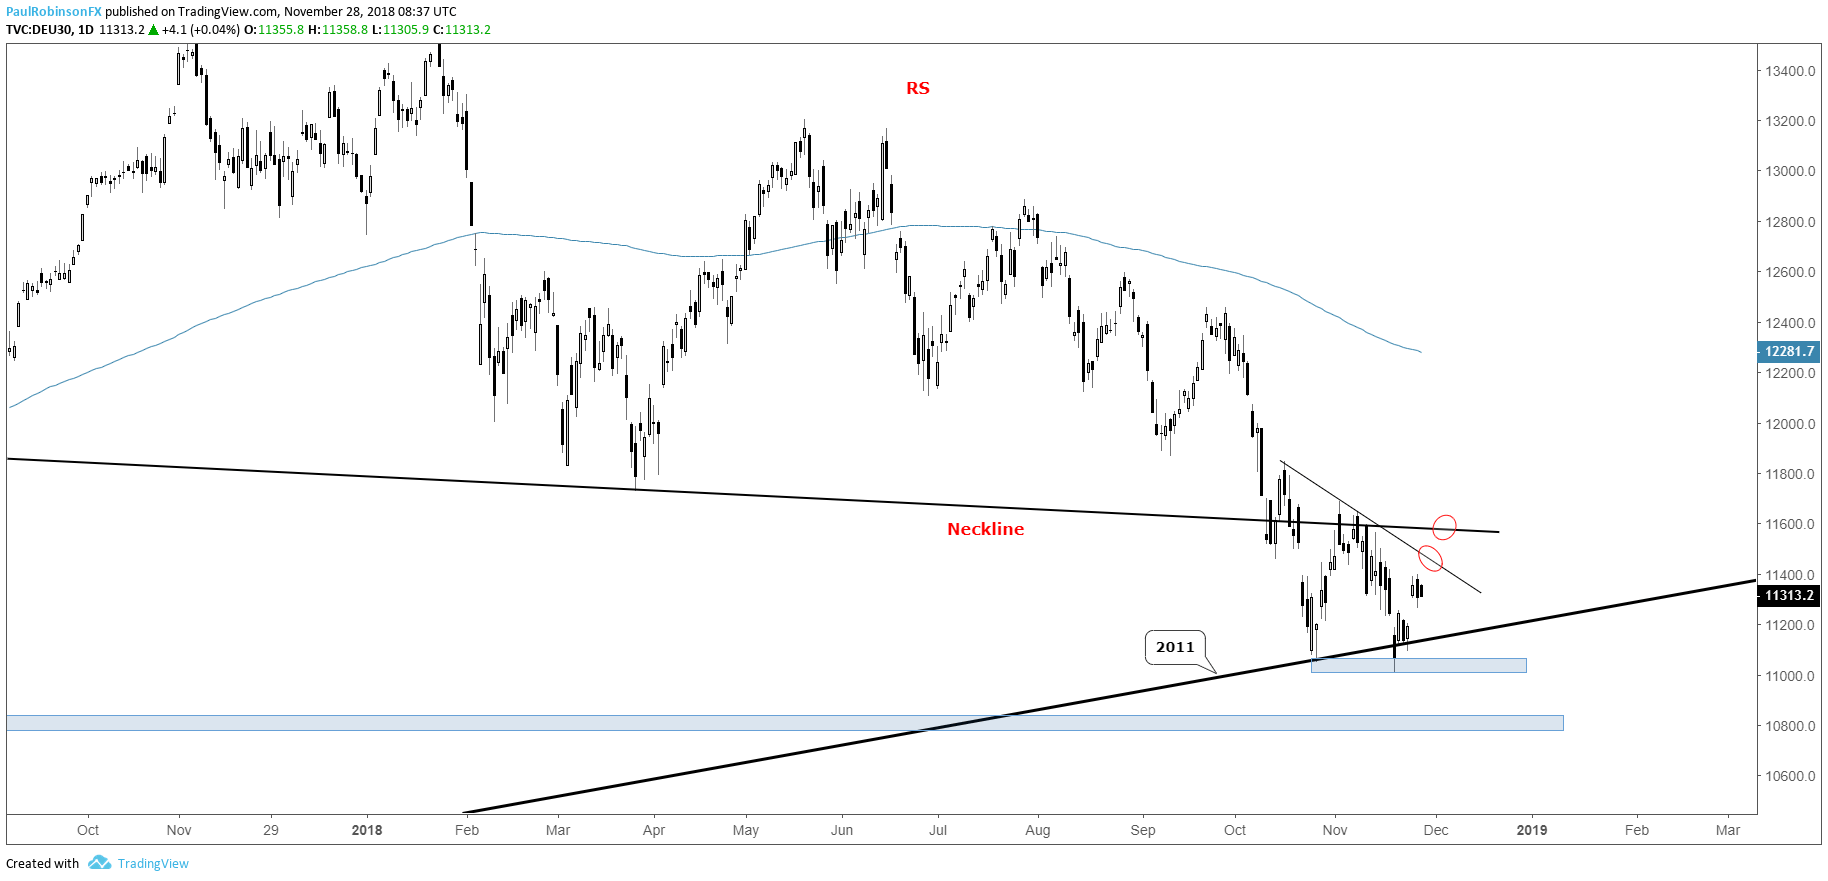
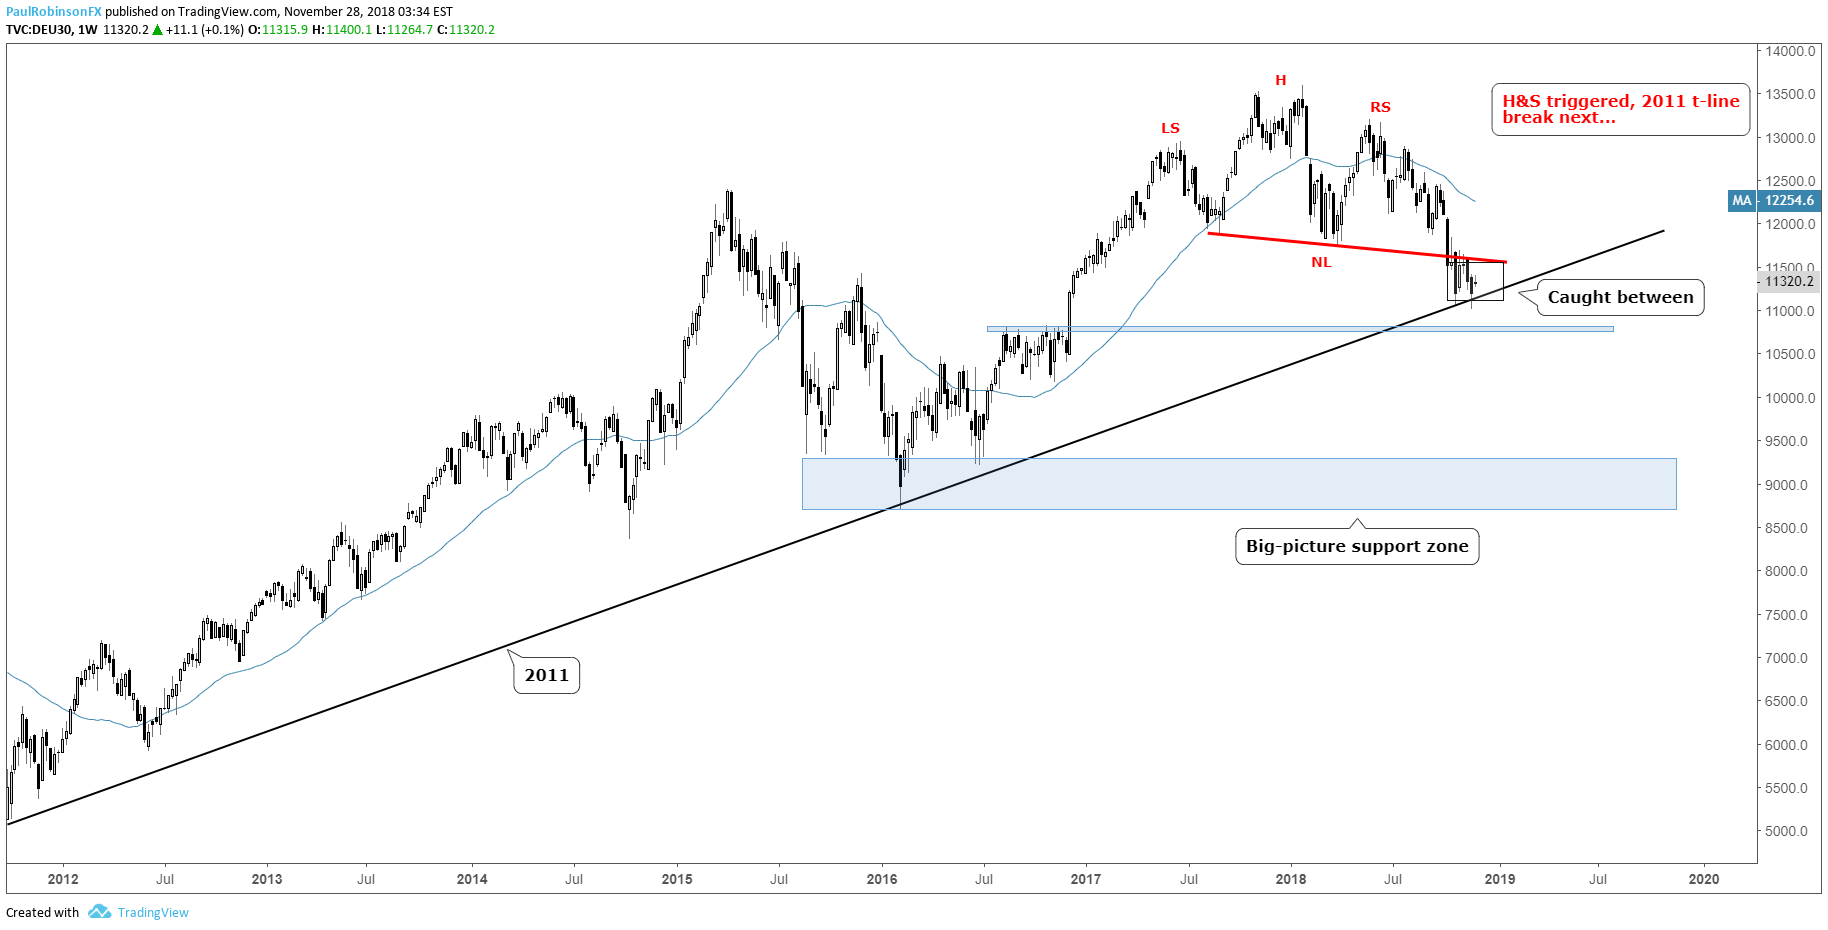
The DAX has for now successfully held the long-term trend-line dating back to 2011, and while it is lifting modestly, strength is at odds with general trend and tone considerations. Not far ahead is a small trend-line to contend with crossing over recent peaks created at the neckline of the long-term head-and-shoulders pattern.
Even if that line is breached the neckline of the H&S formation is just beyond and is likely to be staunch resistance for a market that is on its heels. On a touch of either form of resistance, a shove back lower should give shorts the upper-hand again in the near-term or longer.
A push lower from either current levels or the aforementioned resistance will once again have the 2011 trend-line back in play. It is a sort of tug-of-war between neckline resistance and trend-line support, but from where I sit the broader topping pattern still holds to be the more important technical event. This isn’t just any head-and-shoulders, it’s one that runs back to June of last year – it’s massive in size and suggests the market is in for a large decline.
Nevertheless, we must still respect the trend-line for what it is – support. More time playing ping-pong between top and bottom-side thresholds may be in store before an eventual break. Keep an eye on the U.S. markets as they try to regain their footing, as a break lower with force may have other global markets facing new lows in the current down sequence, including the DAX finally breaking the 2011 trend-line.
For market sentiment and to learn more about how to use it in your analysis, check out the IG Client Sentiment page.
DAX Daily Chart (Bounce looking only temporary)
DAX Weekly Chart (Caught between neckline & t-line)
Want to learn more about trading the DAX? Check out ‘How to Trade the DAX’, and join me weekly for technical updates in the Indices and Commodities webinar.
Forex & CFD Trader Resources
Whether you are a new or experienced trader, we have several resources available to help you; indicator for tracking trader sentiment, quarterly trading forecasts, analytical and educational webinars held daily, trading guides to help you improve trading performance, and one specifically for those who are new to forex.
---Written by Paul Robinson, Market Analyst
You can follow Paul on Twitter at @PaulRobinsonFX


