


There are several long-term trend-lines we focused in on today, which will look to have implications next week; DXY heading towards one, Euro running into one, USD/JPY below one, gold trying to conquer one. Also included are updates from Wednesday’s session.
Technical Highlights:
- US Dollar Index (DXY) could soon see the 2011 trend-line
- Euro in another face-off with 2008 trend-line
- USD/JPY damage done below 2012 trend-line
- Gold looking to close week above 2013 trend-line
For longer-term technical and fundamental analysis, and to view DailyFX analysts’ top trading ideas for 2018, check out the DailyFX Trading Guides page.
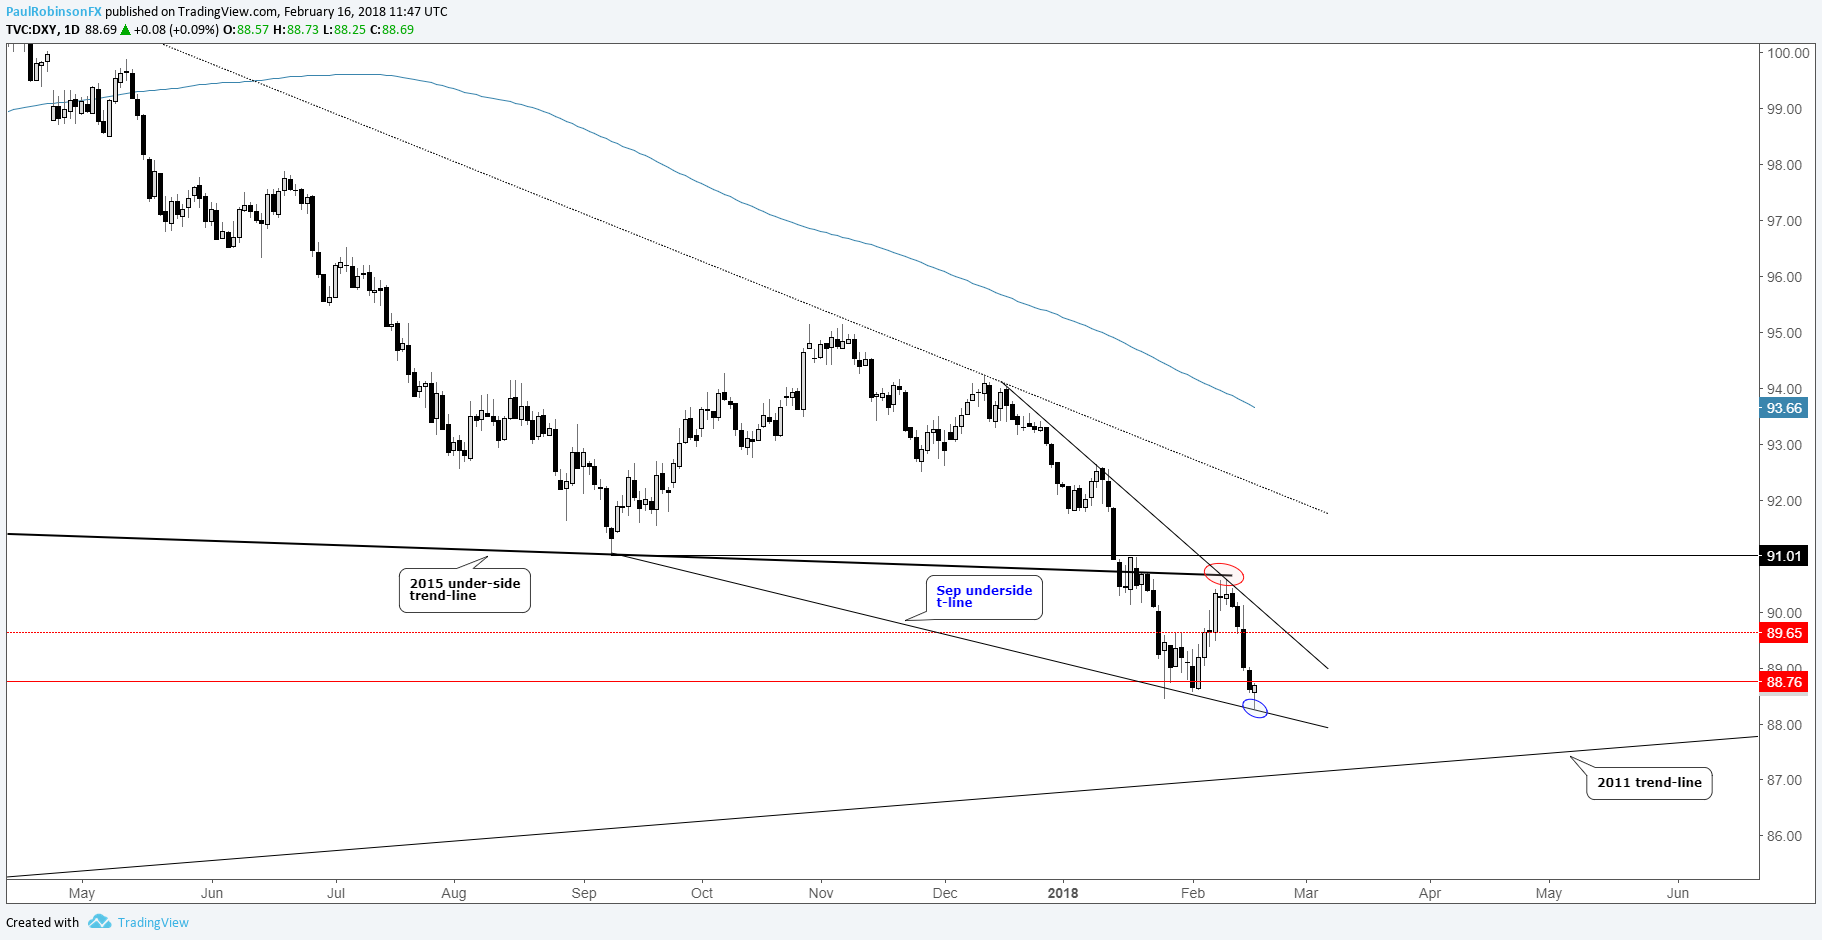
US Dollar Index (DXY) heading towards 2011 trend-line
The US Dollar Index (DXY) had a rough week, swiftly reversing the bounce over the past couple of weeks. This has attention on the trend-line rising up from the 2011 low in the vicinity of 87. There is an underside trend-line from the September low which it is currently bouncing from, but it is seen at this time as only enough to provide a bounce and nothing ultra-meaningful. Early week strength may offer traders an opportunity to jump aboard more dollar weakness.
US Dollar Index (DXY) Daily Chart
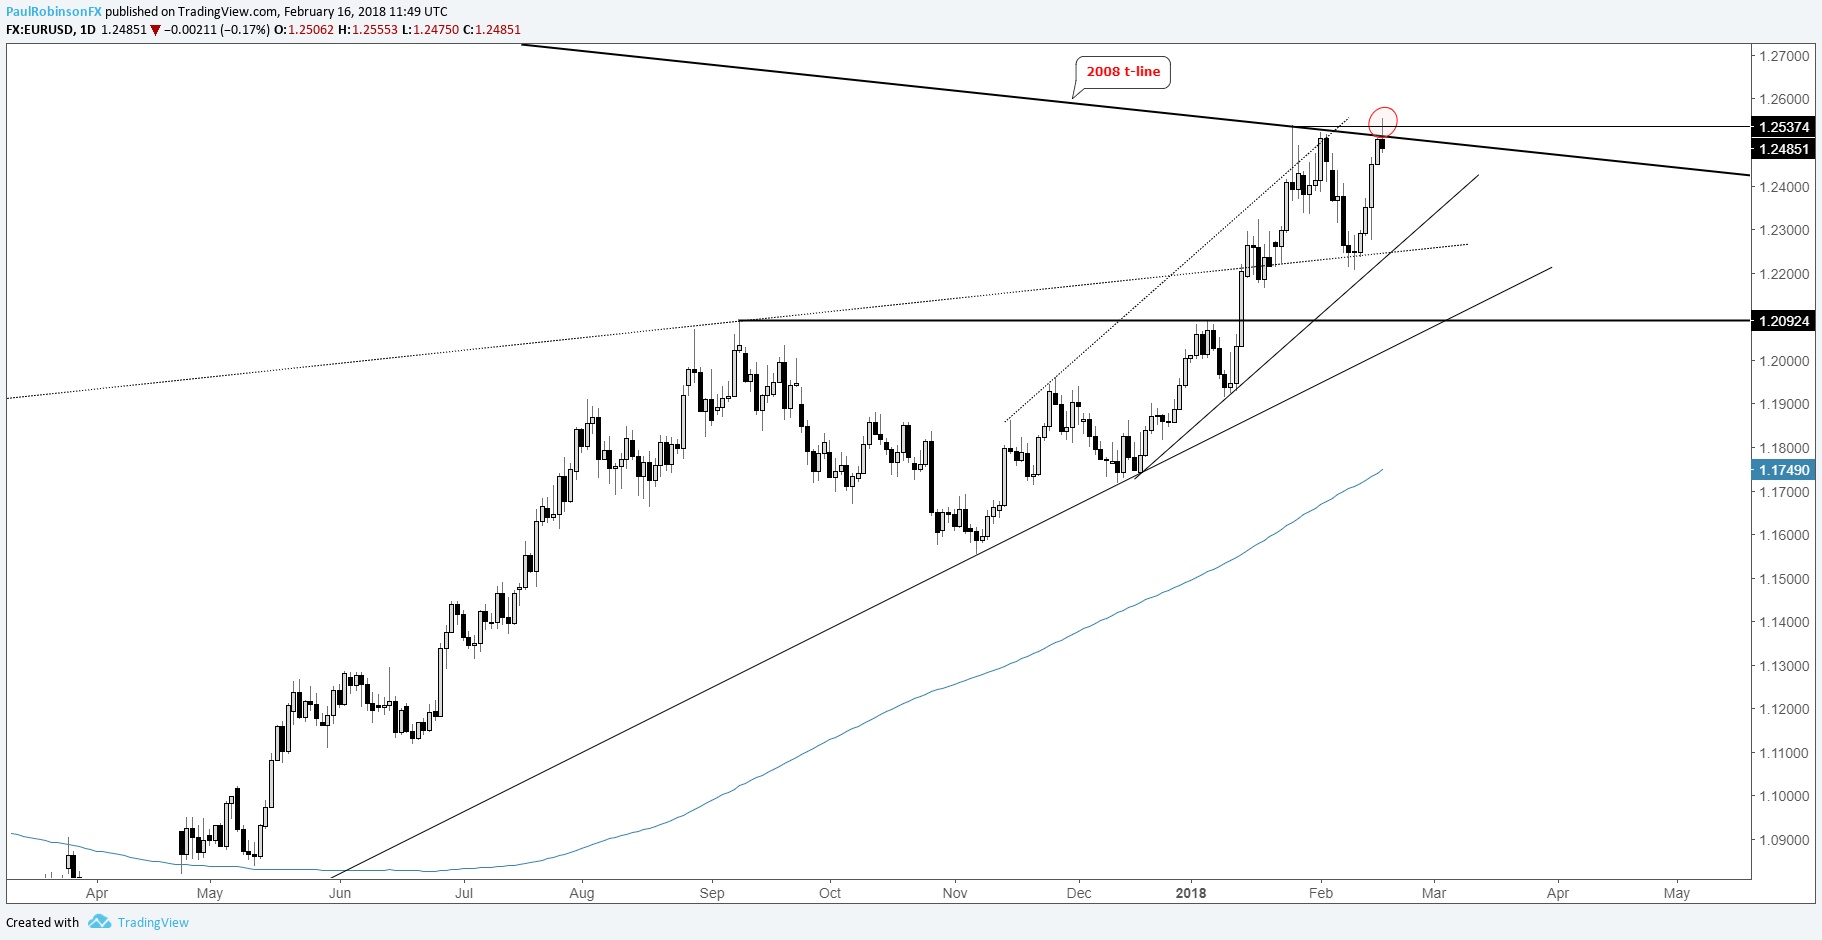
Euro in another face-off with 2008 trend-line
The 2008 downtrend line remains a major obstacle for EUR/USD, but if it can climb above then the look for the DXY (EUR = ~57% of the index) to cleanly break the September underside trend-line and move to the one rising up from 2011.
Is volatility shaking your confidence? Check out this guide, Building Confidence in Trading.
EUR/USD Daily Chart
USD/JPY damage done below 2012 trend-line
USD/JPY breaking the 2012 trend-line on a weekly closing basis could be quite significant, and barring an unlikely 250 pip rally from now through the end of today it’s a confirmed weekly break. Ideally, to initiate new shorts an early week bounce develops and fades. Looking to the low-107s as resistance.
USD/JPY Weekly Chart

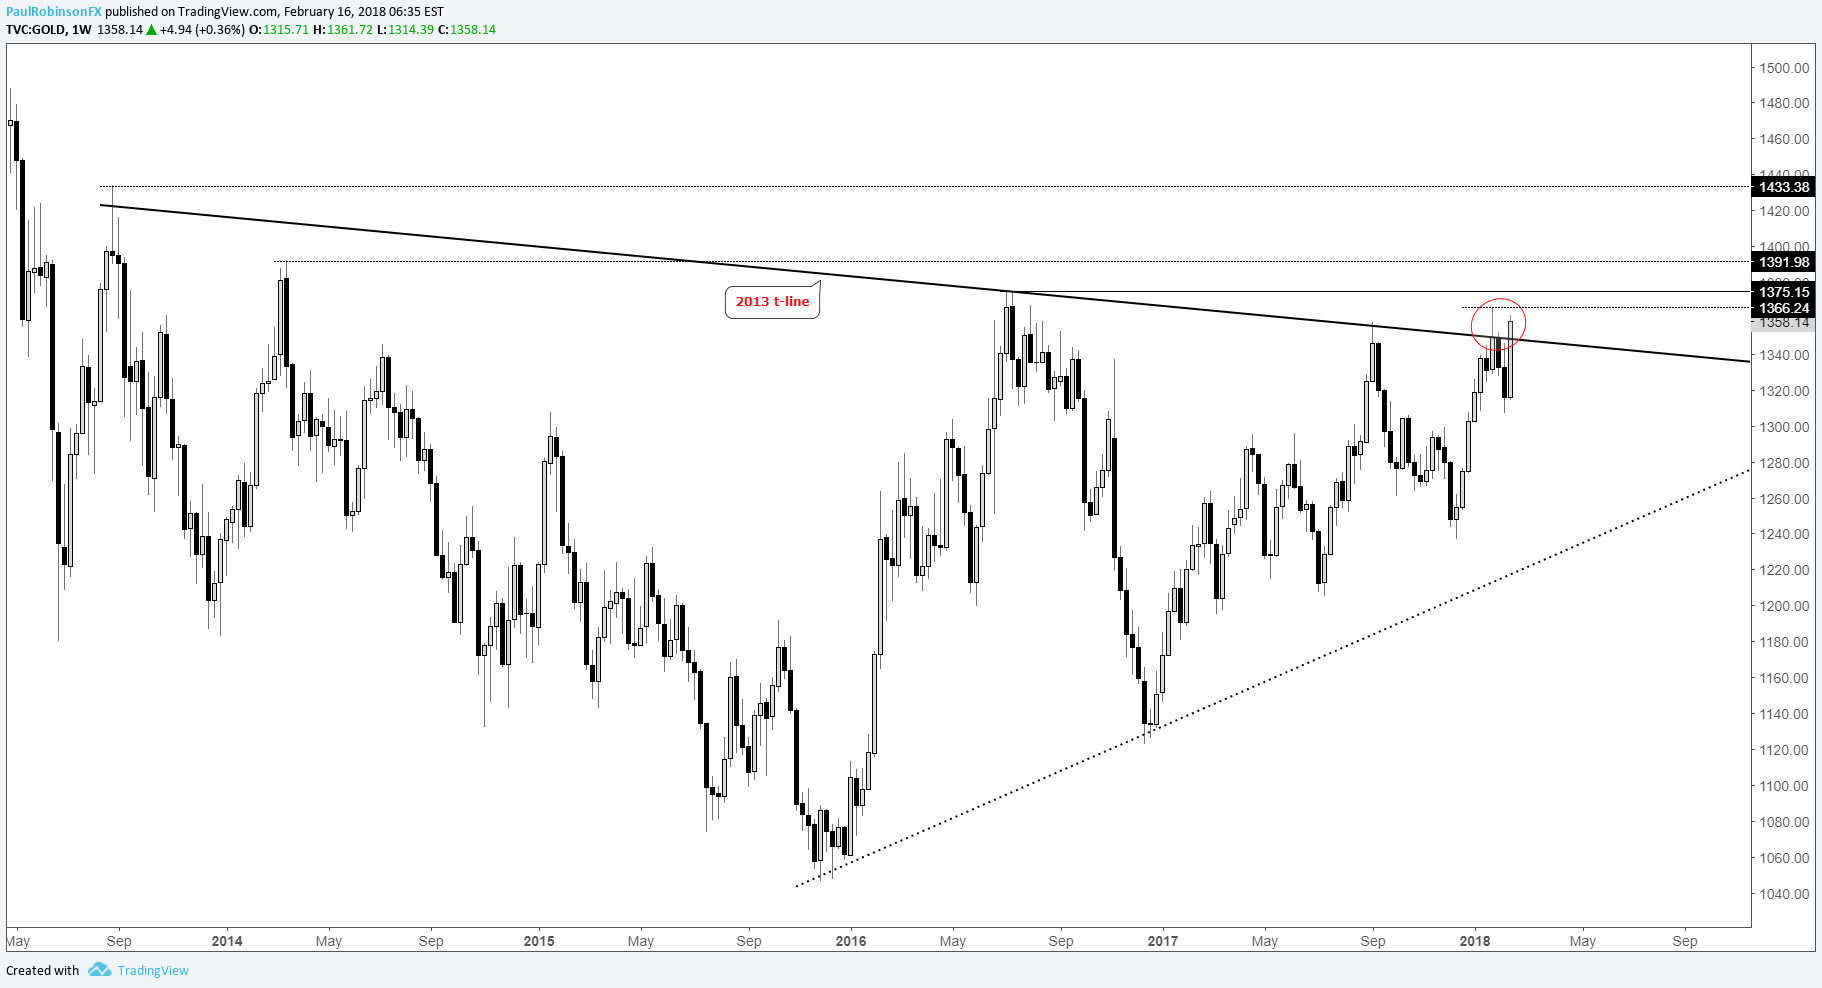
Gold looking to close week above 2013 trend-line
Gold is doing its best to post a closing candle above the 2013 trend-line, thus opening up room to trade towards 1400 and possibly beyond. The closing print (today barring a sharp decline from now) and a push beyond 1366 (last reversal-day high around the trend-line) should get gold rolling.
Gold Weekly Chart
And more…
We did an update on the AUD/NZD trade we’re tracking; took a look at EUR/GBP, EUR/AUD, and EUR/CAD at resistance; GBP/JPY, CHF/JPY big support levels; USD/CAD, NZD/USD, AUD/USD, USD/CHF, and GBP/USD.
Trader Resources
Whether you are a new or experienced trader, we have several resources available to help you; indicator for tracking trader sentiment, quarterly trading forecasts, analytical and educational webinars held daily, trading guides to help you improve trading performance, and one specifically for those who are new to forex.
---Written by Paul Robinson, Market Analyst
To receive Paul’s analysis directly via email – SIGN UP HERE
You can follow Paul on Twitter at @PaulRobinsonFX


