


Enjoy the video? Join Paul Tuesday-Friday each week – for details, see the Webinar Calendar.
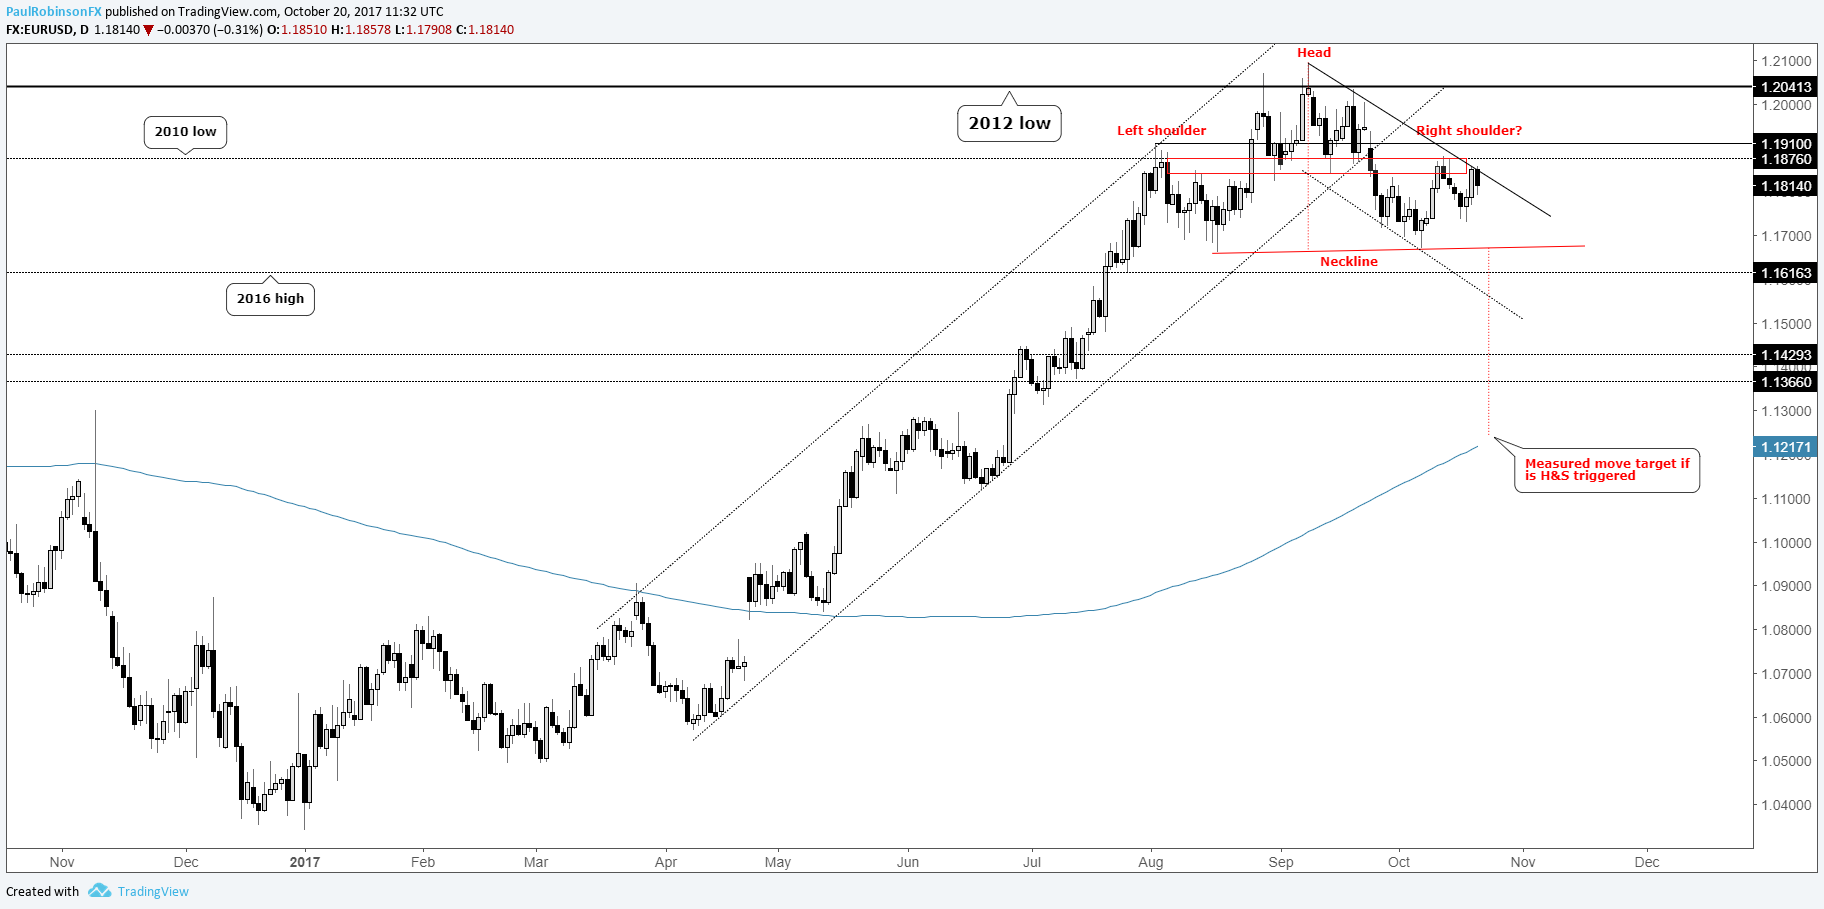
The US Dollar Index (DXY) has done nothing of significance in the short-term but continues to work on a bottoming formation (inverse head-and-shoulders) dating back to early August. EURUSD is the driver behind the index, and as such is putting in a traditional head-and-shoulders top, but until it breaks the neckline it isn’t a valid pattern. With the ECB on Thursday we could have a ‘make-or-break’ catalyst on our hands.
EURUSD:Daily
GBPUSD is neither here-nor-there at the current moment, with the spot of interest lying at a cross-road of support surrounding the 13000-handle. USDJPY is on the verge of carving out higher levels but has some good resistance right in the current vicinity of mid-11300s. NZDUSD is sitting on a big trend-line running higher since 2015, a failure to hold could continue to send kiwi down the drain. We also looked at USDCAD, USDCHF, and AUDUSD.
GBPJPY is trying to make good on its recent hold of support surrounding the 14700-line. Yen-crosses in general have a bullish tone to them. CADJPY is trading outside of a bull-flag on the daily, which is along the path of the least resistance of a broad inverse head-and-shoulders pattern on the weekly.
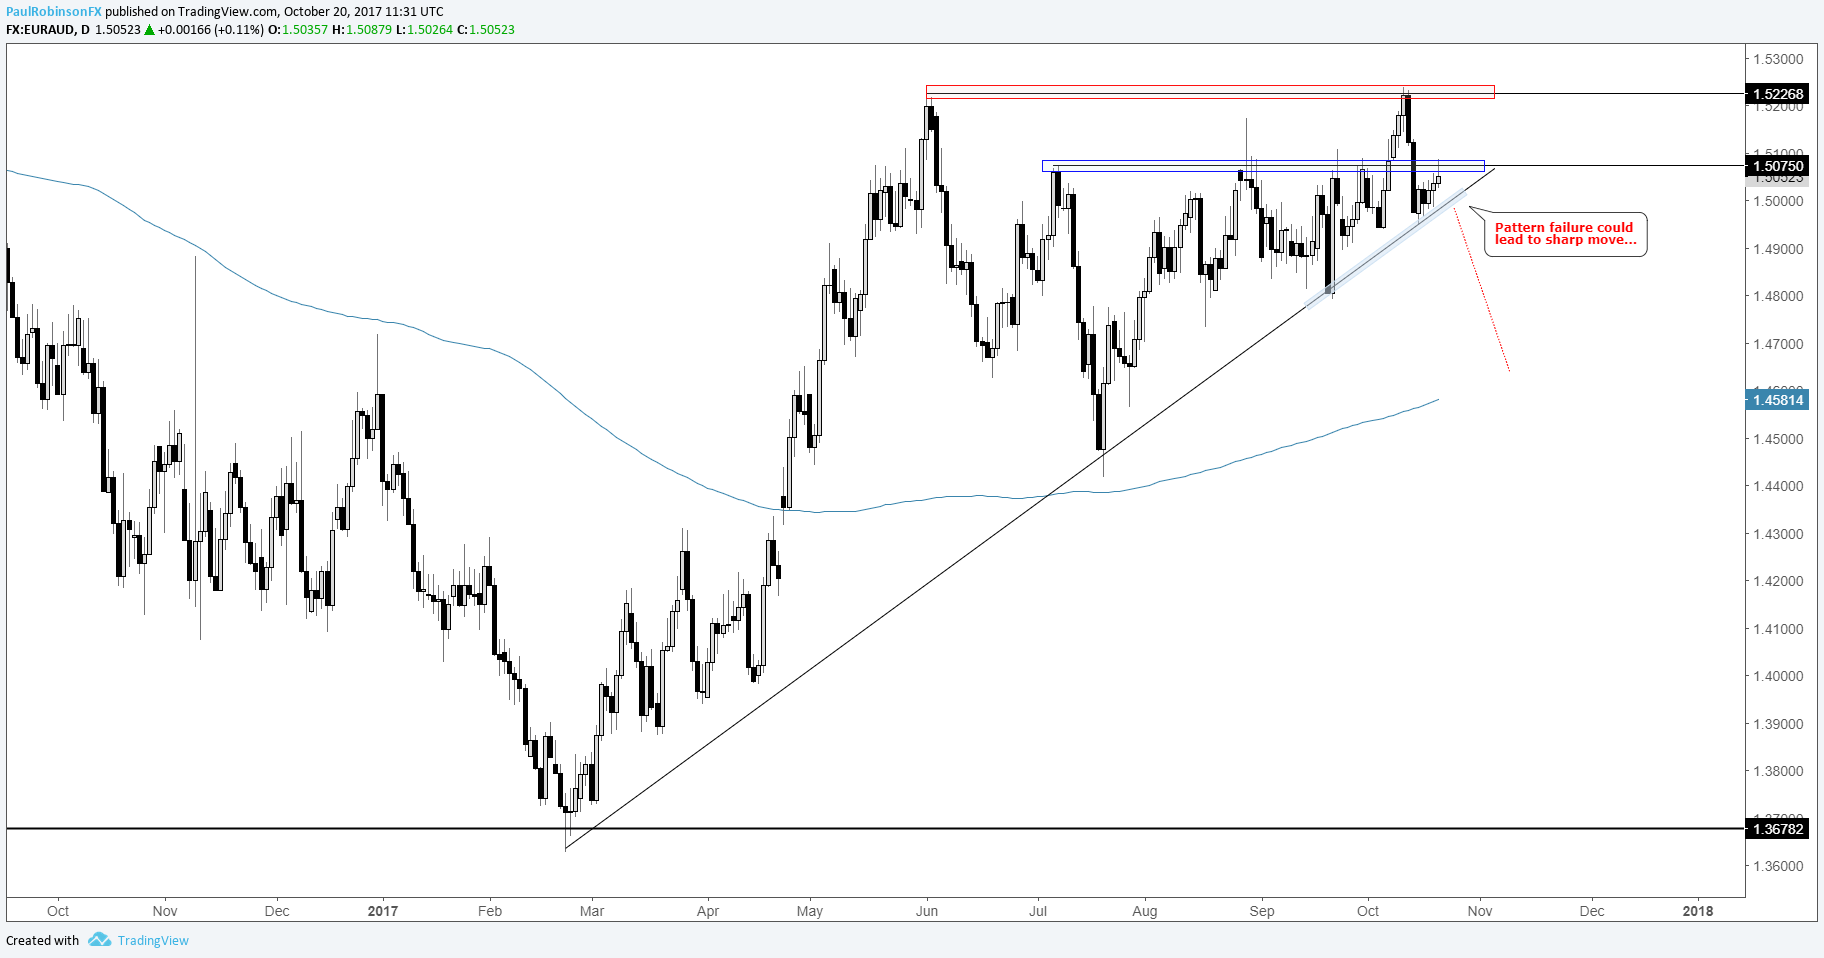
EURAUD is of big interest. Earlier in the month it broke higher out of a multi-month ascending wedge but quickly reversed at the June high, pushing the cross back into the pattern. A break of the underside trend-line of the pattern and t-line since February could lead to an aggressive move lower. Other cross-rates examined were EURNZD, GBPAUD, and GBPNZD.
EURAUD:Daily
Check out this new trading guide – Building Confidence in Trading
Gold still looking weak and headed for the 1260-threshold, which has confluence between a trend-line, 200-day MA, and recent swing-low. Silver to follow suit, but focus is more on gold here.
Equity indices continue to hang strong, but are at critical junctures. The S&P 500 is tight-roping a couple of trend-lines of the shorter and intermediate-term variety. The DAX is trading at a couple of long-term top-side trend-lines which could prove problematic. The FTSE is caught between the Feb 2016 trend-line and ~7550, awaiting resolution.
(The commodities/equity indices portion of the webinar begins here.)
For full technical considerations, please see the video above…
---Written by Paul Robinson, Market Analyst
You can receive Paul’s analysis directly via email by signing up here.
You can follow Paul on Twitter at @PaulRobinonFX.


