


S&P 500, Nasdaq 100, Meme Stocks, VIX, Dollar and Inflation Talking Points:
- The Market Perspective: S&P 500 Bearish Below 4,075; USDJPY Bearish Below 134.00; EURUSD Bullish Above 1.0100
- While the charge in the more risk-leaning assets through last week carried over to Monday, the threshold for keeping above water moved out to specific meme stocks
- Inflation is the principal macro focus heading into Tuesday trade – even if the attention is anticipatory around Wednesday’s CPI release

S&P 500 and Other Benchmark Risk Measures Fail to Break Congestion
The new trading week opened with significant promise for the bullishly-aligned. With the strong NFPs from this past Friday, there was a fundamental backdrop that the otherwise speculatively focused market could use as justification to nudge the markets forward. And, from a technical perspective, it seemed that a modest follow through was all that was needed to at least hit the next milestone. From the S&P 500, the narrow trading range of the past week was butted up against the swing highs from this past May. Even a tentative bullish break could have earned enough attention to attribute a short-term technical resistance break. Alas, there was not enough traction for the market at large to earn even so modest technical milestone. The SPX’s narrow trading range has now extended to an 8th session and reticence has likely hardened inertia – especially before Wednesday’s high-profile CPI release on Wednesday.
Chart of S&P 500 with Volume and 5-Day Historical Range (Daily)
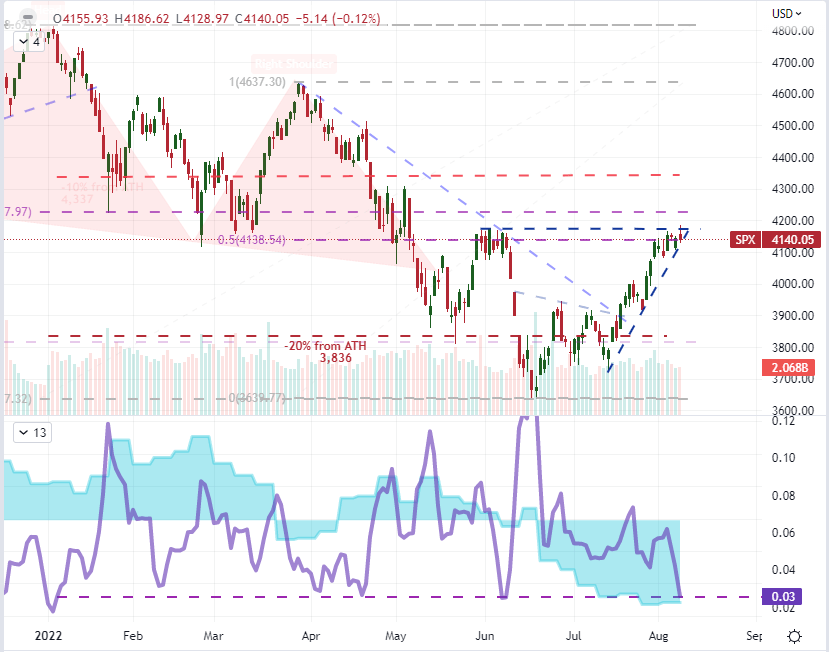
Chart Created on Tradingview Platform
One aspect of the market’s rally that has stood out to me has been the concentrated appetite for risk. Far from a tide that rises all boats, there has been a more narrow appeal for assets that are considered to be higher yielding and by the same token, higher risk. That said, the ‘growth-oriented’ Nasdaq 100’s climb versus its ‘value-attributed’ Dow Jones Industrial Average slipped further through Monday’s session. Even further out on the curve, however, were very prominent but isolated rallies for some of the ‘classic’ meme stocks including a 40 percent rally for Bed Bath & Beyond, a 9 percent rally for Game Stop and 8 percent climb from AMC. This suggests a very specific type of market participant is actively pursuing greater risk, and such narrow fields are not usually the foundations for grander trends.
Chart of Nasdaq 100 Overlaid with Nasdaq/Dow Ratio (Daily)

Chart Created on Tradingview Platform
Relative Volatility Levels Suggest Where Flare Ups May Arise
In evaluating where macro flare ups can occur, the economic docket is a useful tool for scoping probable suspects for significant market movement. Yet a broader appreciation of the undercurrents of fundamental concern as well as appreciation for market conditions can help present a fuller picture. At present, it seems that the risk of recession and the tempo of major central banks’ fight against inflation are the two most consistent themes that we come back to at the moment. In another perspective of the market’s disposition, I mention in the weekend report that the 32nd week of the year – which we are currently traversing – historically sees a significant build in the VIX volatility index. While there is considerable potential for sparks to fly, it is worth noting that relative implied levels of the FX and yields markets remains comparatively high in historical terms to commodities, equities and emerging markets. If we are to see an avalanche of fundamental interest, it seems it will likely begin in these corners of the market.
Chart of Volatility for FX, Treasury Yields, Oil, Equities and EM Markets YTD 2022 (Daily)

Chart Created on Tradingview Platform
Speaking of FX, the Dollar has found an uneasy balance between its two-decade highs set in July and the 50-day moving average that has traced the market’s course higher for six months. As reflection on its narrow price action itself, the 15-day historical range is meaningfully narrow, but the same periods ATR (average true range, a measure of realized volatility) is still near levels not comparable since the pandemic volatility charge. Putting into practice the fundamental perspective, I ran a rolling 20-day correlation between the DXY Dollar Index and the 2-year yield as a gauge to rate forecasts and then to the VIX for a reflection on its safe haven capacity. Interestingly, the more consistent and strong correlation to the currency was a combination of both. I am not a particular fan of combining themes like this, but it seems to reflect those combined roles well.
Chart of DXY with 50-Day SMA Overlaid with US 2-Yr Yield – VIX Ratio, 20-Day Corr (Daily)

Chart Created on Tradingview Platform
Top Event Risk – On the Docket – Ahead
Arguable the strongest potential catalyst for both the forecast for US interest rates and the perception of risk tied into recessionary pressures is the forthcoming US CPI (consumer price index) due to be released on Wednesday. Making for an even more interesting event, the New York Federal Reserve released its Summary of Consumer Expectations for the month of July on Monday. Most notably, their reported forecast for inflation over the coming 1 and 3-year time frames dropped markedly from 6.8 to 6.2 percent and 3.6 to 3.2 respectively. That doesn’t guarantee that it will certainly show through in the market-favorite CPI update, but the market is sufficiently tuned into timely readings that are seen as having a forward looking projection. Combine this data with the price components of last week’s ISM service and manufacturing surveys, and it seems the pressure may be easing.
Chart of US CPI YoY With 1 and 2-Year Consumer Inflation Expectations and 5yr-5yr Forecasts (Monthly)
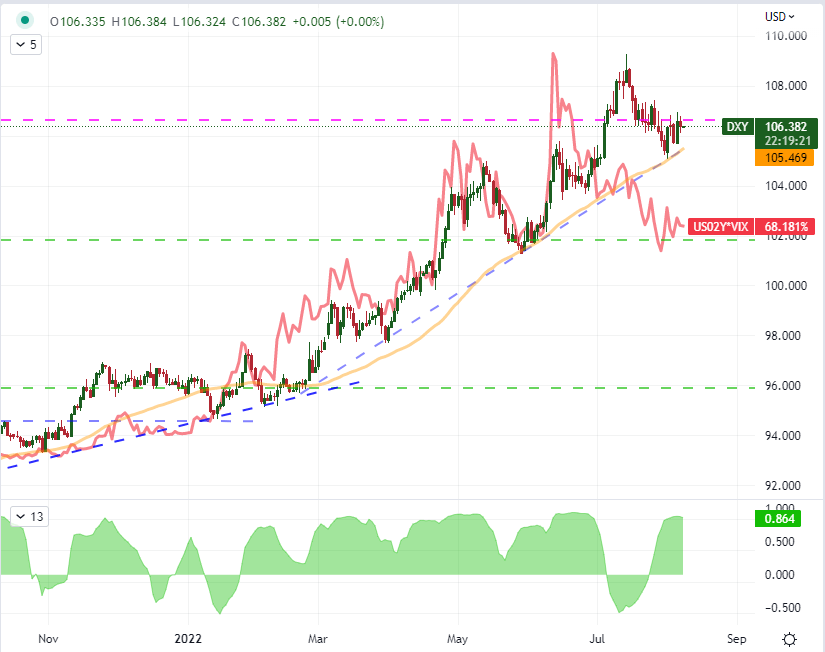
Chart Created on St Louis Federal Reserve Economic Database
It will be hard to override the market’s anticipation for the Wednesday ‘main event’ outside of an unexpected and broad spectrum event, but that doesn’t meant that the fundamentals between now and then won’t matter. Following in the footsteps of the poor showing of the Japanese Eco Watchers survey (forecast from 47.6 to 42.8) and the Eurozone investor sentiment measure from Sentix (‘better than expected) but deep in negative territory at -25.2, we have a string of US sentiment based surveys. The NFIB small business report, IBD economic optimism reading and the STEO oil and gas forecast give an important overview of the world’s largest economy.
Global Calendar of Major Macro Economic Event Risk for the Next 48 Hours

Calendar Created by John Kicklighter


