


S&P 500, Alibaba, GBPCAD, EURUSD, USDTRY and USDZAR Talking Points
- The S&P 500 is due a technical breakout; and this close to record highs, a chart based move is likely to demand a fundamental reasoning
- Earnings will continue to stir market headlines with the Alibaba and JD.com giving a distinctive Chinese perspective – which could offer further macro consideration versus the likes of WMT
- For scheduled data, monetary policy is still a top theme ahead; but UK and Canadian CPI will be swapped for the Turkish and South African rate decisions

S&P 500: A Break Is Coming
There is less than 48 hours left in this trading week, and the probability of a technical break from the S&P 500 within that time frame is high. With a similar picture for the Dow and Nasdaq 100, the benchmark US index sees its lowest 5-day volatility level (ATR) and trading spans (historical range percentage of spot) since the early September top. This is not to mean that I expect a bearish resolution – aka: a reversal – but the activity level and anchor to record highs is a conspicuous situation for the markets to entertain for long. What’s more, these are the kind of conditions in which a sharp technical move is likely to drive market participants to develop a ‘fundamental narrative’. The unknown scares people more than a mere loss of capital. That said, should the S&P 500 clear 4,675, expect the fear through inflation, monetary policy or growth forecasting to gain meaningful traction.
| Change in | Longs | Shorts | OI |
| Daily | 1% | -1% | 0% |
| Weekly | 15% | -13% | -1% |
Chart of S&P 500 with 50-Day SMA, 5-Day ATR and Historical Range (Daily)
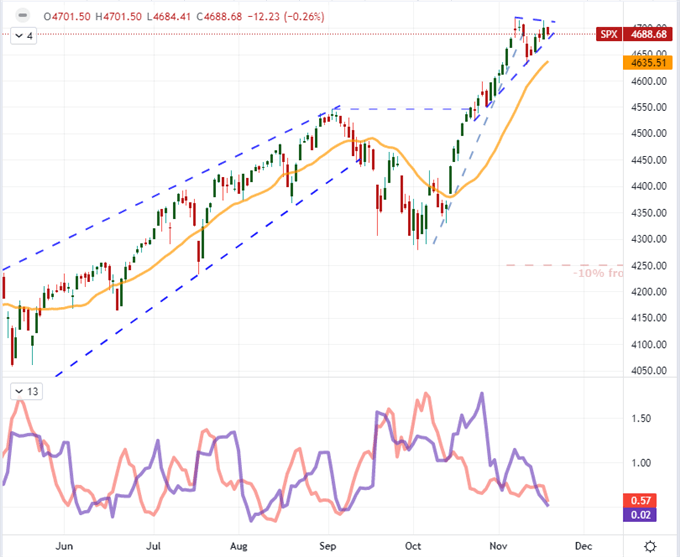
Chart Created on Tradingview Platform
While my concern over the probability/potential skew on risk appetite has been distorted for a some time, recent warnings have amplified the worry. The Federal Reserve, last week, warned that risky asset prices were stretched in its semi-annual report on financial stability. This past session, the group’s largest counterpart, the ECB, issued its own localized evaluation with much the same warning. According to the group, the Euro-region’s housing prices and financial market were extended and thereby at risk of rebalancing. For the skeptical among us, this seems a rather tepid interpretation of the situation; but you have to remember that the these major central banks rarely draw attention to issues in the financial system as they aim to avoid self-immolation. Voicing concern is therefore a remarkable event.
Chart of Wilshire 5000 Index Overlaid with St Louis Fed Financial Stress Index (Weekly)
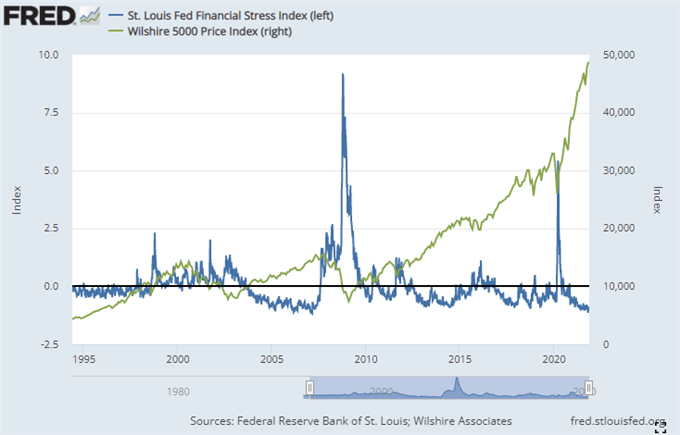
Chart Created on FRED with Data from St Louis Fed and Wilshire Associates
The Fundamental Score
While I’m seriously concerned about the degree of indulgence in risk-leaning assets, I also appreciate that so broad and abstract a theme is not prone to a decisive and abrupt reversal very often. Therefore, my approach is to suppress my own concerns and interpret what matters most to the speculative rank. There is both macro-economic event risk and earnings to drawn from as catalyst to sudden risk moves. On the corporate side, this past session offered up 3Q reporting from US consumer powerhouses Target and Lowe’s. Like its counterpart Home Depot, Lowe’s beat expectations on post-pandemic home projects while LOW’s jumped on the open. In contrast, Target beat the consensus and its forecasts topped while it warned that it was absorbing higher prices. That is similar to the situation with Walmart where share price dropped despite the assurances of its own accounting department. Meanwhile, China’s Baidu warned about growth and saw its own shares slump. I will be watching to see whether Chinese e-commerce giants Alibaba (BABA) and JD.com (JD) follow a similar weight. If so, the relative WMT to BABA ratio carries more fundamental for me than USDCNH itself.
Calendar of Major Macro Event Risk for the Week
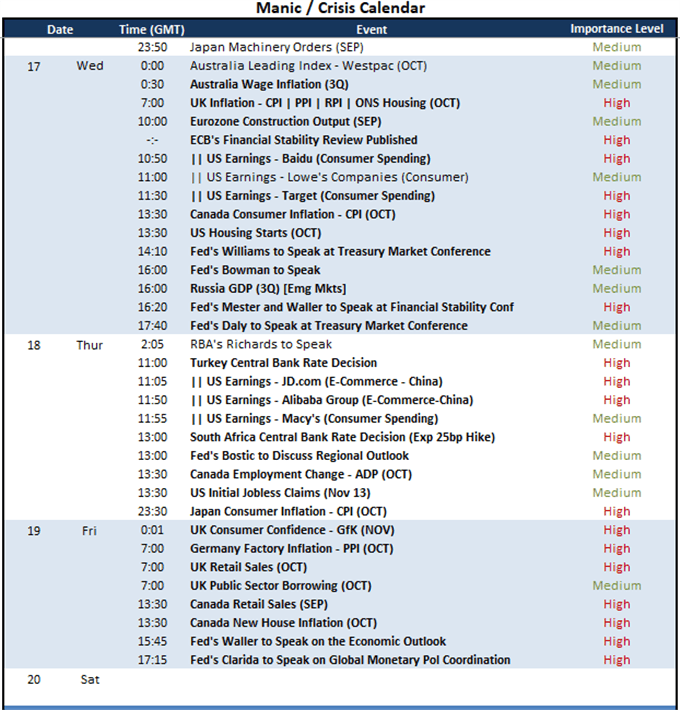
Calendar Created by John Kicklighter
For traditional economic data this past session, the United Kingdom’s and Canadian inflation reports were of top concern. Both measures bested expectations – UK CPI accelerating to 4.2 percent and Canada’s 4.7 percent – but there was a clear difference in performance. We can see the contrast in performance around data from GBPCAD. The pair extended its rally enough to extended its inverse head-and-shoulders ‘neckline’ break to a further 100-day SMA break. The matter here is that the Canadian Dollar never truly relinquished the premium to the BOC’s rate forecast, but the Sterling extended its dive after the last BOE rate hike. Therefore, there was more discount to cover after the data.
Chart of GBPCAD with 100-Period Moving Average (8-Hour)
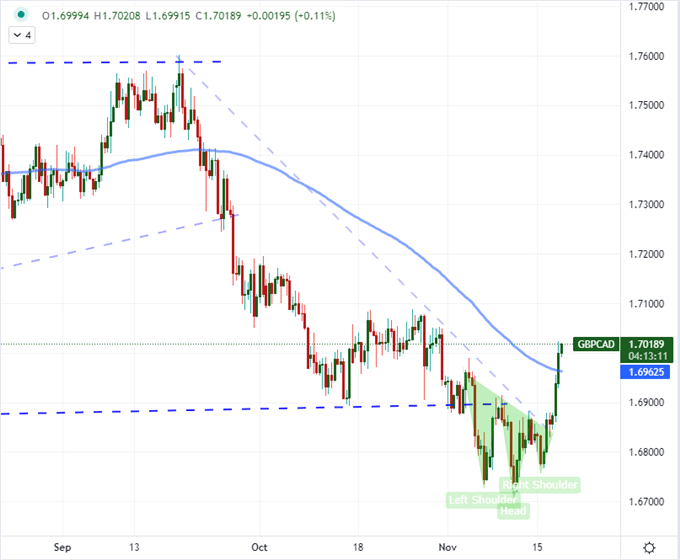
Chart Created on Tradingview Platform
Top Markets to Watch Ahead
While my interest in the core of risk assets like the S&P 500 and the tentative turn from crude remains intact moving forward, I will also be gauging next steps for deeply-rooted markets that have technical stretch and fundamental weight. EURUSD, technically extended its slide to fresh 16-month lows this past session; but it did so with a sharp intraday reversal that left the biggest ‘lower wick’ on the cross’s daily chart since late May. This seems a reversal risk, but don’t presume that it is a run that can naturally last for multiple hundred pips. As an aside, close relative to the EURUSD, EURCHF is pushing 1.05 support. A floor on the pair around this figure is essentially the primary policy focus of the extremely accommodative SNB. That said, it doesn’t mean that the group can keep the markets back (as was made abundantly clear in January 2015).
Chart of EURUSD with 100-Day SMA and Daily Wicks (Daily)
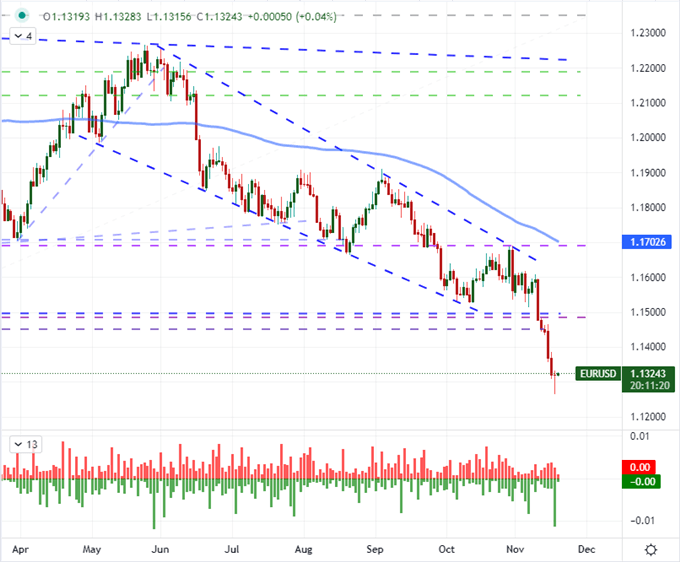
Chart Created on Tradingview Platform
As for active market movers, USDTRY is at the very top of the list. The pair is already running at a troubling pace. The drive to fresh record highs on the fastest bullish clip in months is even more remarkable given that policy authorities are trying to curb the Lira’s plunge. The Turkish central bank is losing control over its ability to influence its own exchange rate as the market balks at the group’s effort to cool rampant inflation by cutting rates – the opposite of standard Western monetary policy. The policy authority could potentially stall this kind of move by offering up a modest rate hike to undercut speculation, but that seems an unlikely strategic move. Watch this pair closely.
Chart of USDTRY with 50-Day SMA and 3-Day Rate of Change (Daily)
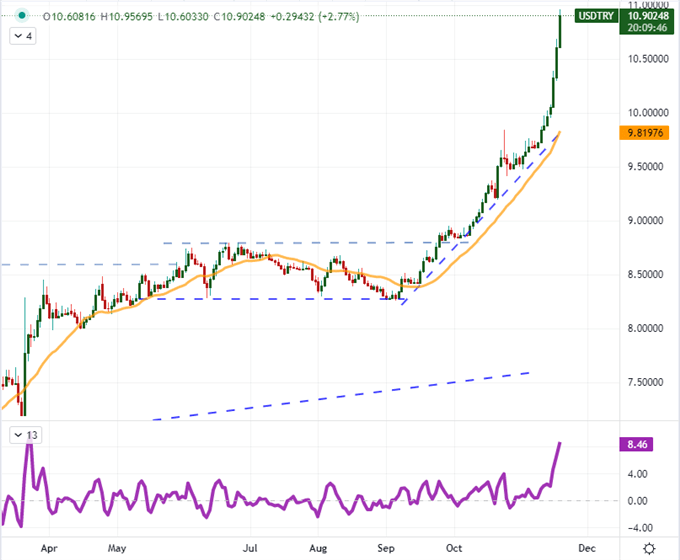
Chart Created on Tradingview Platform
In contrast, high inflation is pushing expectations of a South Africa Reserve Bank (SARB) rate hike at the upcoming meeting. The problem is that this outcome is heavily expected and the ZAR is already under pressure. Taking a look at the USDZAR cross, we have moved into resistance that is both the neckline of an exaggerated head-and-shoulders pattern along with the 100-week SMA. A bullish break above 15.50/75 would be a meaningful development, but it will not likely come easy. If the SARB is neutral/dovish while the Dollar continues to gain traction, that would offer the most definitive scenario. Alas, ideals are infrequent scenarios.
Chart of USDZAR with 100-Week SMA (Daily)
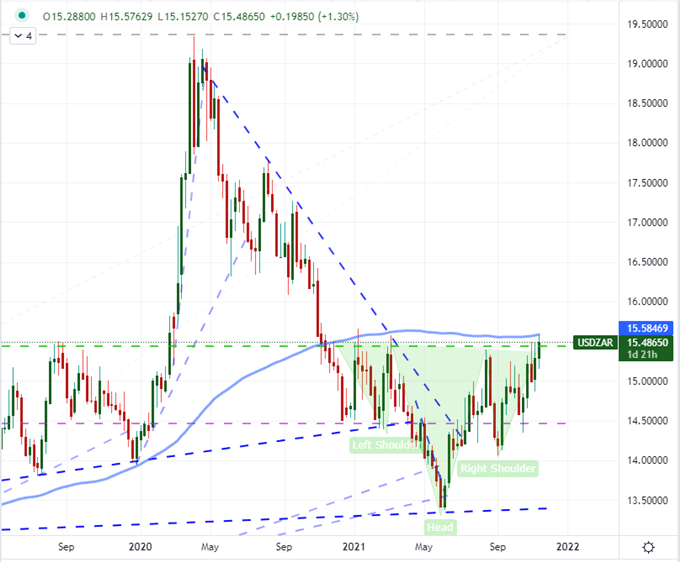
Chart Created on Tradingview Platform


