


USD/ZAR Technical Outlook
- USD/ZAR base-building taking on shape of inverse H&S pattern
- Formation could lead to a big top-side move in coming months

USD/ZAR Technical Outlook: Big-picture Base Has Big Potential
USD/ZAR has gone effectively nowhere this year when you look at where it was to start the year and where it is today. But that doesn’t mean it hasn’t been doing anything. There has been some good-sized swings year-to-date, and those swings are etching out a pattern that could lead to a big move into 2022.
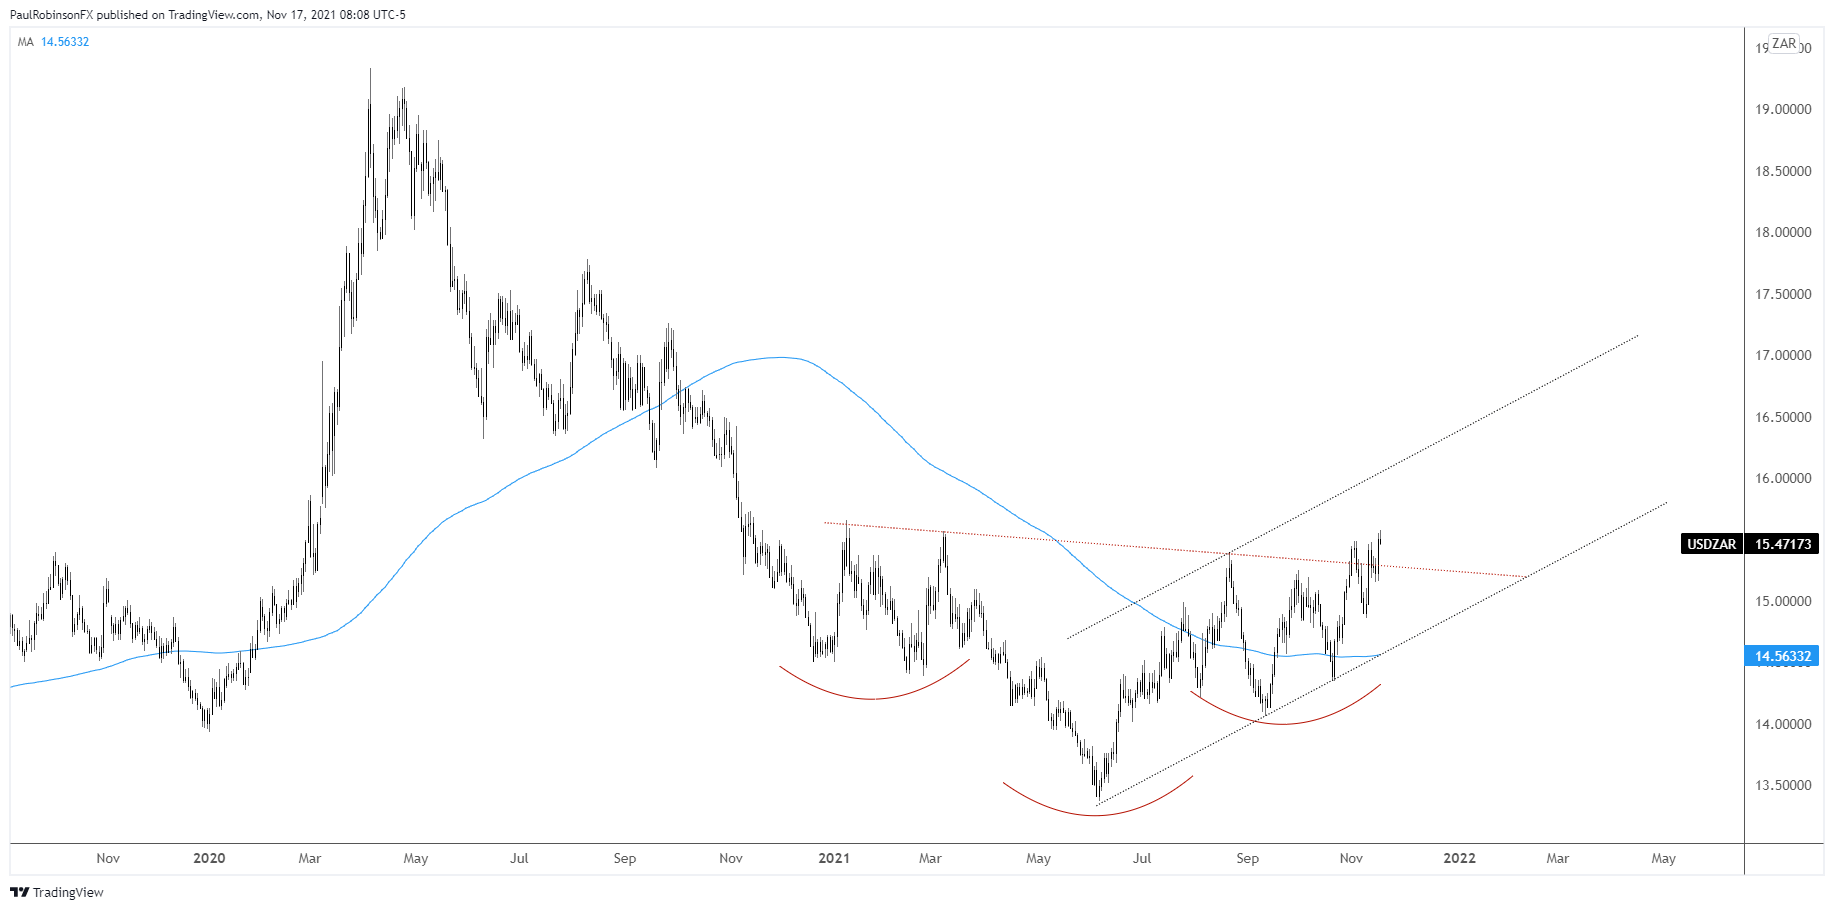
The inverse head-and-shoulders pattern that is forming has an interesting look at an interesting spot on the long-term chart. The head is around a trend-line from 2011. There was a temporary breach of the line back in May, but it was quickly taken back with the right shoulder forming on a test and revalidation the trend-line in September. This play around the trend-line makes it an important one.
On a daily basis one could make the case that USD/ZAR has broken the neckline of the inverse H&S pattern, and thus been validated. But given the size and duration of the pattern, a weekly close is preferred.
We may see the desired weekly close by Friday. If we continue to see USD/ZAR hold at current levels or extend, then we will get validation. This would then be seen as leading to continued strength into the year end and well into 2022.
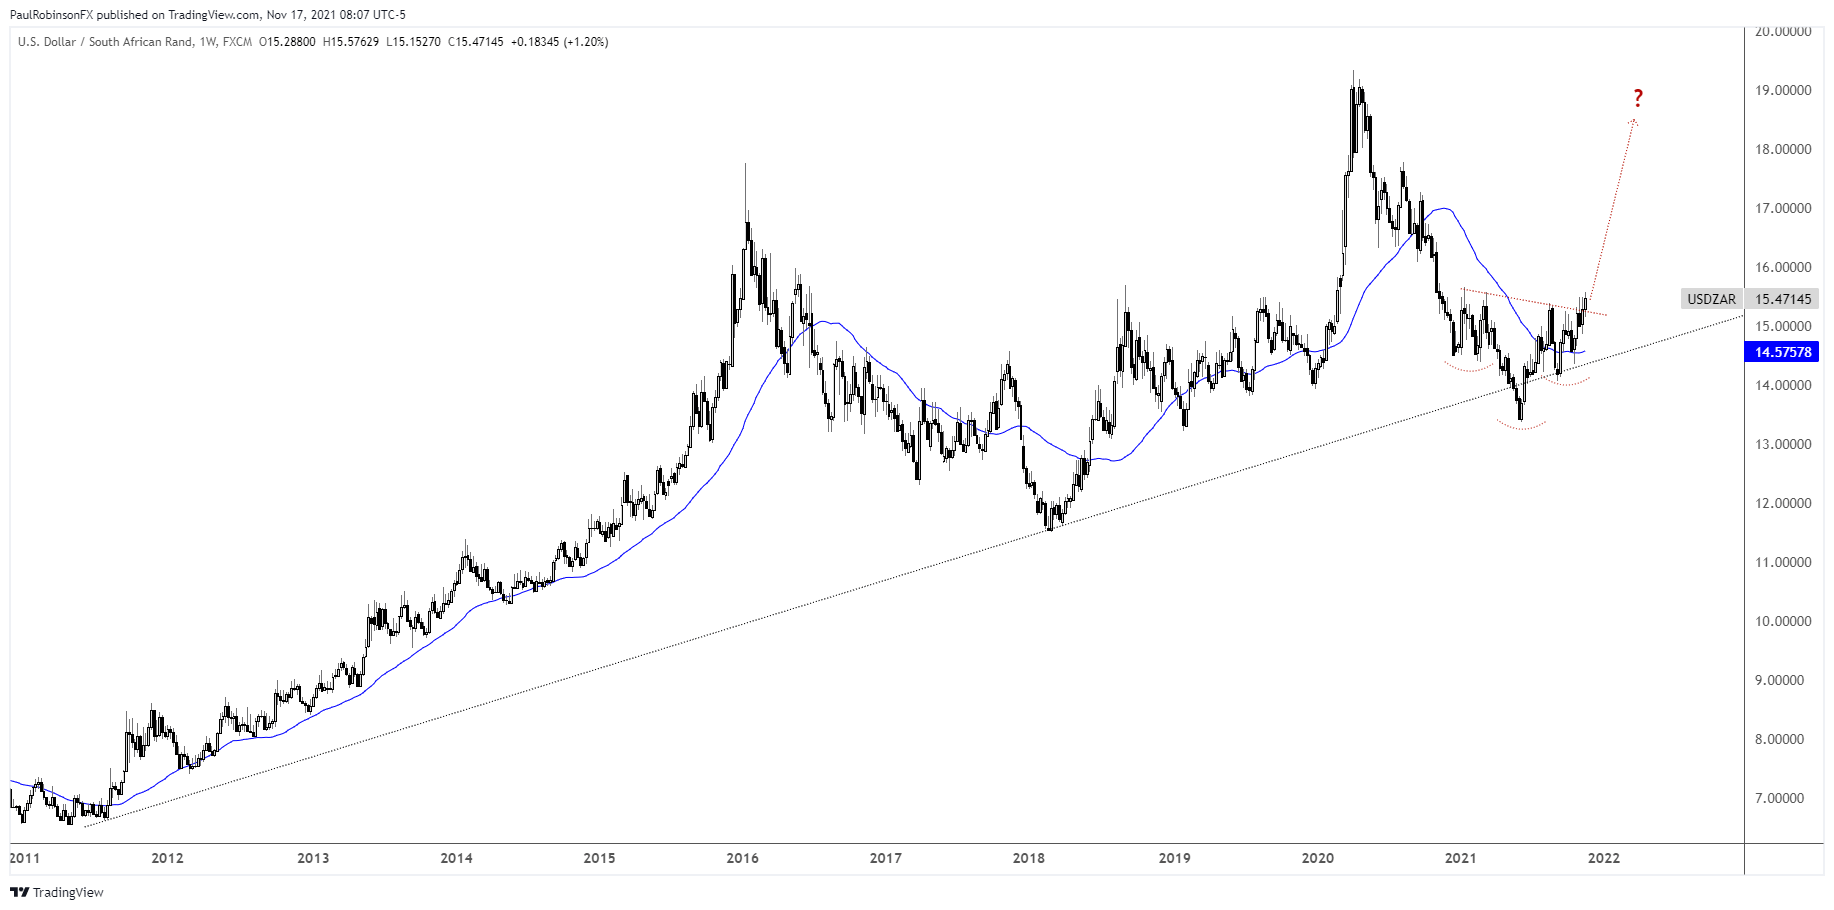
The depth of the pattern alone suggests we see a measured move of two full points beyond the neckline, or up to the lower to mid 17s. Looking at the long-term trend, it is possible this is a bottom before another major bull market leg higher that takes USD/ZAR to 20+.
For now, waiting for confirmation of a good solid close above the neckline on a weekly basis and will keep trading bias inline with such an event. If USD/ZAR fails to confirm, then that will leave the bias neutral and at some point it could turn negative, but that will take some time at this juncture.
USD/ZAR Weekly chart
USD/ZAR Daily Chart
Resources for Forex Traders
Whether you are a new or experienced trader, we have several resources available to help you; indicator for tracking trader sentiment, quarterly trading forecasts, analytical and educational webinars held daily, trading guides to help you improve trading performance, and one specifically for those who are new to forex.
---Written by Paul Robinson, Market Analyst
You can follow Paul on Twitter at @PaulRobinsonFX


