


Dow, Nasdaq 100, VXX, USDJPY, EURUSD and GBPCAD Talking Points
- The Dow extended its slide through Thursday and support is now in sight, but true conviction in sentiment will be measured across the financial system
- Extreme congestion on ‘risk’ benchmarks like the Nasdaq 100, USDJPY and VXX ETF represent a risk of a possible violent ‘normalizing’
- Top event risk through the final day of trade this week includes the US factory inflation, a run of UK data including GDP and Canadian jobs data

Risk Assets Continue to Plateau and Build Fear
There are few things that people – and investors – fear more than the unknown. When it comes to the deviation in market prices and value, there is a wide and inexplicable gap. However, concern over that disparity can be effectively quieted by external support like stimulus and so long as the markets continue to drift higher in favor of the average long-only investors. Yet, when that advance takes a long and unsettling pause, doubt creeps in. We can see that very uncertainty factoring in for the Dow Jones Industrial Average which has not held as steady as the Nasdaq in this barren period and is instead now leaning heavily against prominent support. It is times like these that we start to consider issues like the severe disparity between a NDX and DJIA – the most extreme favor for the former since the Dot-Com bubble peak – and what a correction of this would look like.
| Change in | Longs | Shorts | OI |
| Daily | -18% | 18% | 7% |
| Weekly | -19% | 14% | 4% |
Chart of Dow Jones Industrial Average with 100-Day SMA with 100 SMA Disparity Index (Daily)
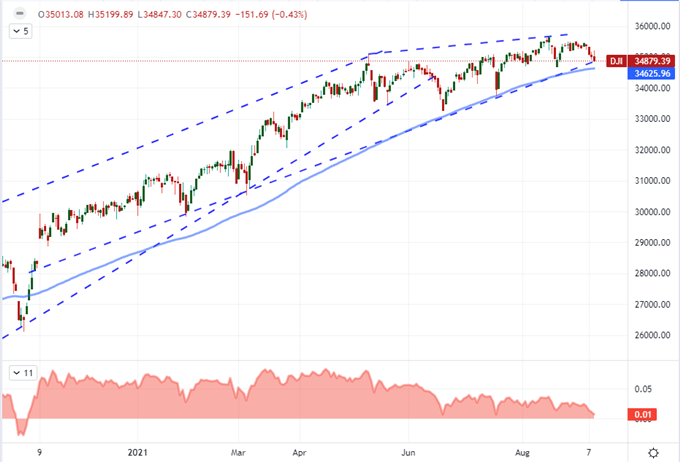
Chart Created on Tradingview Platform
Extreme Congestion Raises Breakout Risks
Following along the lines of the US indices, where the Dow is actively listing and engaging its technical boundaries, the tech-heavy Nasdaq 100 seems to be refusing the normal ebb and flow. The restraint is so remarkable that it leaves us with a very immediate support at 15,500 and an extremely narrow range of trade – the smallest 7-day trading range we have seen in years – which is the foundation for a serious breakout risk. The issue is not whether this breaks, but what kind of state the market is in to receive breaks. Is it a natural development or bound to induce panic?
Chart of Nasdaq 100 with 50-Day SMA with 7-Day Historical Range (Daily)
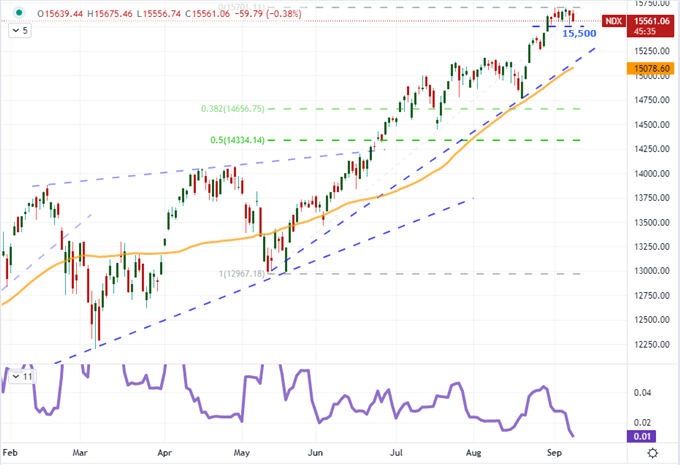
Chart Created on Tradingview Platform
Another ‘wound up’ measure of market activity is the VIX volatility index itself. The modest jump from the middle of this week has since deflated and put us back into the lulls that compare to the pre-pandemic market conditions. That is not so extreme in historical terms, but other measures of short-term market activity are exhibiting more extreme interest, if not action. The VXX short-term volatility ETF remains one the early warning signals for a systemic shift in sentiment and a technical break of 28 – preferably with a surge in volume – will be my first line in the sand.
Chart of VXX Short-Term VIX ETF with 100-Day SMA and Volume (Daily)
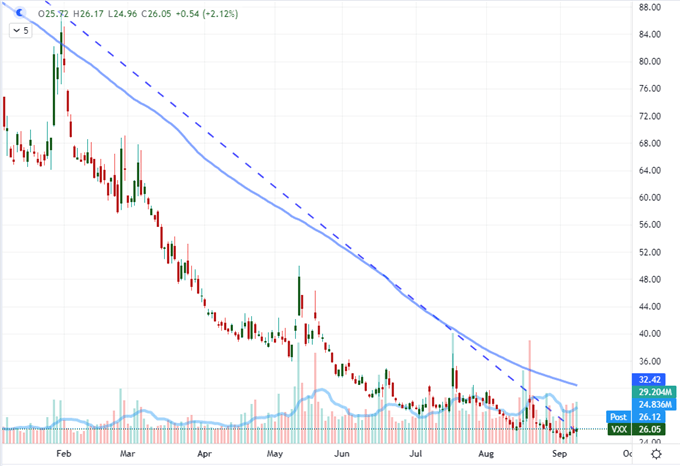
Chart Created on Tradingview Platform
While USDJPY is another measure of risk itself in the FX market’s carry trade vein, its correlation to the general course of sentiment has diminished materially over the years – likely as a result of the collapse in global interest rates. Broad congestion has been an essential feature of the USDJPY activity over the past five years, but the pair seems to have found itself in something like a Russian Doll of range. While there are larger ranges to be found on monthly and weekly charts, the oscillation between 108 and 111.50 these past months has narrowed the trading corridor. Over the past 16 days specifically, the pair has held an approximately 100-pip range – the smallest trading band over that range of time I have on record. A first level break would be from the 110.50 – 109.50 range, but with a little additional speculative charge, the move that follows could be even more productive.
Chart of USDJPY with 16-Day Historical Range (Daily)
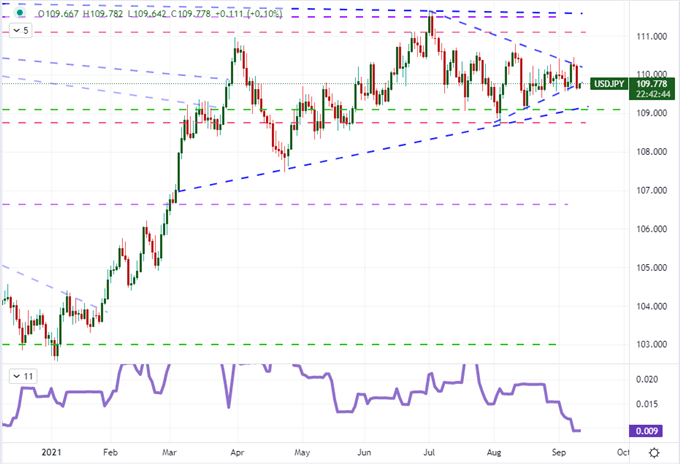
Chart Created on Tradingview Platform
Fundamentals: Monetary Policy and Scheduled Event Risk
For motivation, monetary policy was this weeks most overt theme. The European Central Bank (ECB) wrapped up the major groups that were scheduled to weigh in on their settings for this week and they managed to do what few others have achieved. Europe’s monetary policy authority announced a taper without the tantrum that has often followed such news. How did they achieve this? ECB President Christine Lagarde made an Olympic effort to convince the market that the reduction in the PEPP would be a ‘calibration’ rather than a taper. This is a mere technicality as what they are doing is indeed a taper. Attempting to avoid the recognition of a taper is ill-advised as it creates a greater sense of anxiety for when it is pursued, but a reduction in external support should be considered favorable as it reflects a strong inherent course of growth. Unfortunately, that sentiment doesn’t yet exist and further tapers should be considered potential speculative depth charges.
Chart of Central Bank Relative Monetary Policy Perception
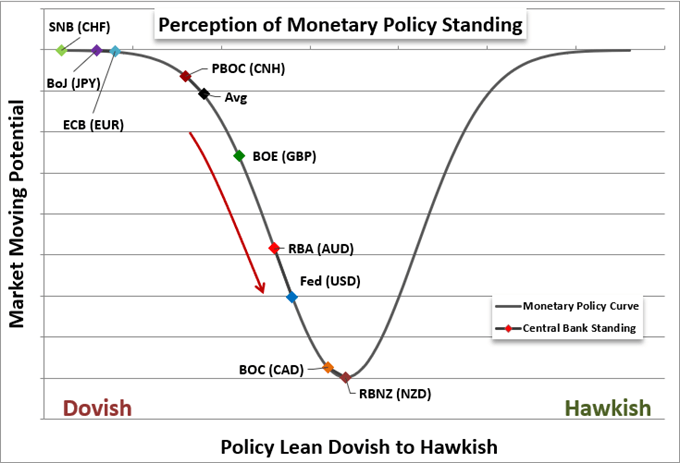
Chart Created by John Kicklighter
Despite the (relative) hawkish shift from the ECB, European indices charged higher this past session and the Euro generally slipped. From the likes of EURCHF, EURGBP and EURJPY; the second most liquid currency would indeed register a fast slide. However, EURUSD was a notable exception. Why would this cross diverge from the general performance? Likely because the central bank’s move was a moderation from its extremely dovish position and the fact that the Greenback itself was under pressure this past session. There wasn’t much to urge the Dollar into a material retreat this past session as the Fed’s Bowman stated that a taper was likely this year, initial jobless claims hit a pandemic low while there was a modest safe haven charge. A bearish trend is unlikely for the USD unless something else comes in to provide a strong driver.
Chart of EURUSD with 50-Period SMA (Daily)
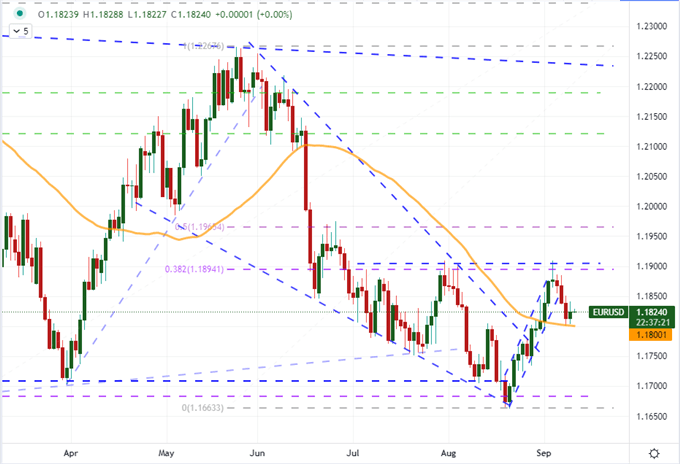
Chart Created on Tradingview Platform
Looking for a fundamental charge for the Greenback to close out this week, there is meaningful event risk on tap in the former of factory inflation (PPI). Commodity cost pressures seem to have eased in certain areas such as lumber prices, but upstream inflation has certainly not abated enough to direct expectations for consumer level relief. Just this week, Kraft Heinz announced it had passed through higher costs to consumers on two-thirds of its US portfolio; which joins many other companies that have reported the same including Tyson and Johnson & Johnson. As much potential as there is in the US inflation report, I believe there is more charged volatility potential from the UK’s run of July data or Canada’s employment update. The Sterling is already under power in its upswing, so a strong run of data could amplify an existing momentum.
Chart of GBPCAD with 50, 100, 200-Day SMAs (Daily)
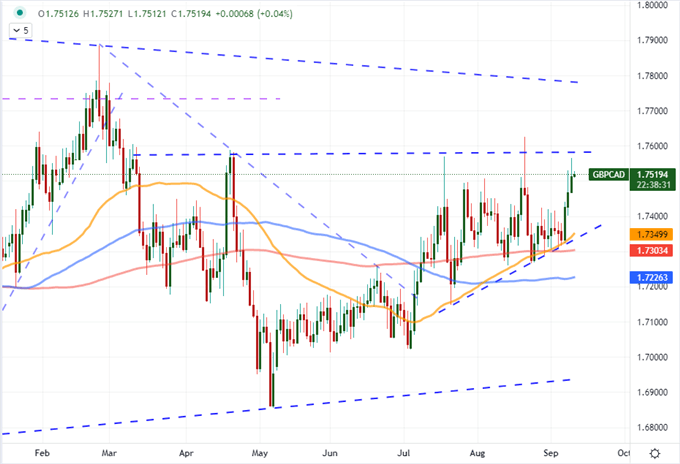
Chart Created on Tradingview Platform


