


S&P 500, Dollar, Bitcoin, Dogecoin and Emerging Market Currencies Points:
- The S&P 500, Dow and Nasdaq 100 all notched record highs to close this past week; but progress for US indices is not the standard on risk
- Market volatility and volume are fading in-line with both systemic and seasonal factor while very specific events/regions face charge like the Euro and Canadian Dollar
- A bounce in risk trends would seem to align neatly to the Dollar’s ebb, but rate forecasts and appetite for anti-fiats likely had more pull on the currency at present

US Indices Continue to Set an Unrealistic Pace for ‘Risk Trends’
Through this past week, there was an uneven charge in favor of risk appetite that matches the market conditions and mixed backdrop of systemic fundamental drivers we continue to digest. Continuing to lead the way, the major US indices are both putting up remarkably progress while hosting a particularly constrained pace. From the S&P 500, four consecutive weeks of advance is the longest stretch for my preferred benchmark risk index since August though the tempo leaves much to be desired. In fact, the past 10-day ATR (a measure of realized price-based volatility over the past two weeks) has dropped to its lowest level since January of 2020 – the most restrictive activity level in 15 months. That is not particularly off beat for the seasonal norms for April, but there is further a cyclical factor at play. As the pandemic pressures have eased, we find market volatility and volume at levels akin to what was unfolding in the second half of 2019 when Trade War premiums were deflating. How long can these ‘goldilocks’ conditions continue before something upends the apple cart?

Chart of S&P 500 with 100-Day Mov Avg and 10-Day ATR (Daily)
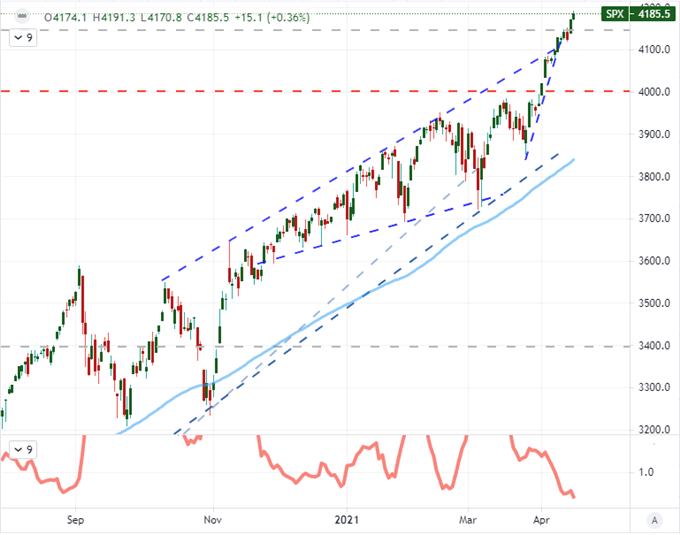
Chart Created on Tradingview Platform
Part of the unique mix of risk trends in current conditions is the stimulus-backed complacency fueling a penchant for assets that are top-of-class for pre-established momentum: as opposed to assets with a meaningful discount in value or some measure of income (dividend, yield, carry, etc). Between errant risk appetite and capped liquidity conditions, we are more likely to see isolated charge for specific assets according to speculative appetite and event risk. There is plenty of scheduled data over the coming week, but my expectations are going to be held in check. In the meantime, the prevailing pressure for the Dogecoin continues to defy gravity. There is no definitive measure here to justify a year-to-day climb that has topped 10,000 percent at its peak. Instead, it is the sheer appeal of momentum that has accelerated the coin’s incredible climb. Meanwhile, Bitcoin has been banned by Turkey while Coinbase’s listing on stock exchanges has charged the baseline for cryptocurrency.
Chart of the Dogecoin DOGEUSD (Daily)
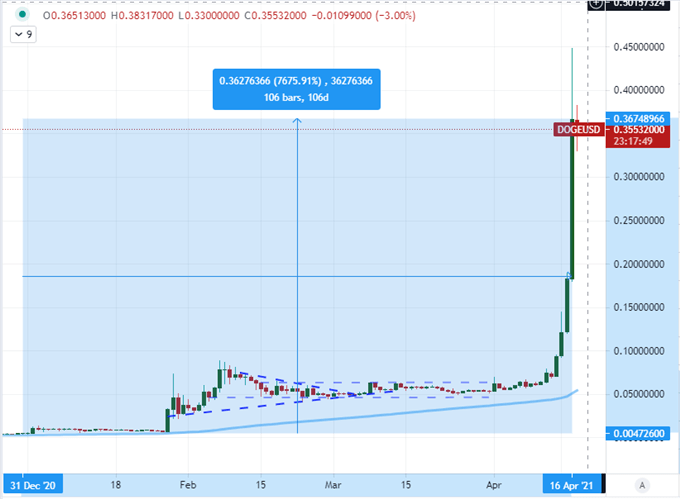
Chart Created on Tradingview Platform
Market Conditions Carry Greater Weight Than Fundamentals or Technicals
While the docket and the charts exert enormous influence over the markets, complacency continues to affect a greater influence over how we trade. Seasonally, the month of April sees from a benchmark like the S&P 500 a slide in both volume and volatility (VIX) that seems only compounded by recent conditions. It is possible that a further retrenchment in speculative uncertainty boosts speculative reach even further, but there is little discount that has yet to be worked off nor dry powder yet to be deployed to a willing financial market. As I see it, there is a skew of probability versus potential. While it is more likely that speculative benchmarks extend their prevailing trends, the potency of impact would be greater if we found our course leaning in the opposite direction.
Chart of S&P 500 with 4-Week ATR Overlaid with VIX Volatility Index (Weekly)
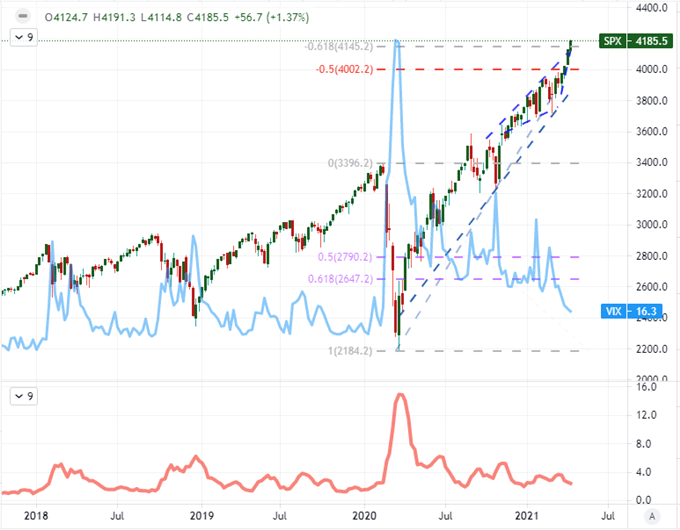
Chart Created on Tradingview Platform
Another major milestone for the market that presents a probability / potential imbalance is the US Dollar. The Greenback continued its slide through this past week to close within striking distance of the midpoint for 2021’s range – the 91.35 mark that splits the low established just a few days into the year up to the high notched at the end of March, which is also the ’50 percent Fib’ of the 2014 to 2017 phase of the last major bull wave. That period is a significant one on a fundamental basis as it represents the charge that personified the market’s early recognition of monetary policy shift to tightening from taper signaling to early rate hikes. These past few weeks, the hawkishness that has been building over the past year has eased back in both the US 10-year Treasury yield breaking back below 1.60 while the implied Fed Fund futures tightening through end of 2022 has dropped as low as 15 basis points. Without key data to further the journey of speculation on this important theme (at least not a CPI, NFPs or IMF forecast), we may find the retreat difficult to sustain to meaningful new lows.

Chart of DXY Dollar and 100-DMA, Overlaid Fed Funds Dec 2022 Forecast (Daily)
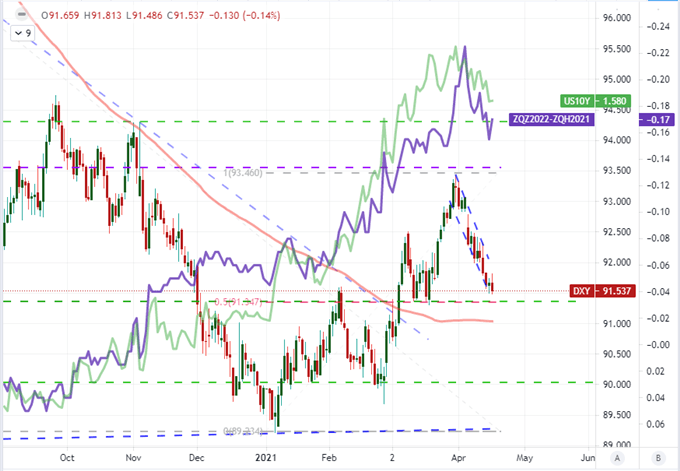
Chart Created on Tradingview Platform
Concentrated Possibilities in Event Risk and Chart Patterns
With a backdrop of complacency in risk trends and seasonal liquidity swoon, it may prove difficult to break the spell of a steady moderation across the entire system. On the other hand, the thinned conditions can work to amplify activity for non-standard assets that are not as beholden to a ‘wait and see’ perspective. In terms of key event risk in the week ahead, the earnings season could still exert some pressure. While the thematics may wane without a banks run, there are still some important companies reporting. In particular Tuesday’s run of Johnson & Johnson (vaccination darling), Netflix (FANG member), CSX (growth through shipping) and Interactive Brokers (retail trading as a broker) data can rouse serious themes. Alternatively, though unlikely a high productivity pair itself, I will be watching EURCAD in the FX market over the coming week as it represents the confluence of both the Bank of Canada rate decision on Wednesday and European Central Bank on Thursday. Neither is expected to move on their policy mix, but any shift from status quo could be meaningful hear or other Euro or Loonie crosses.
Chart of EURCAD with 50-Day Moving Average (Daily)
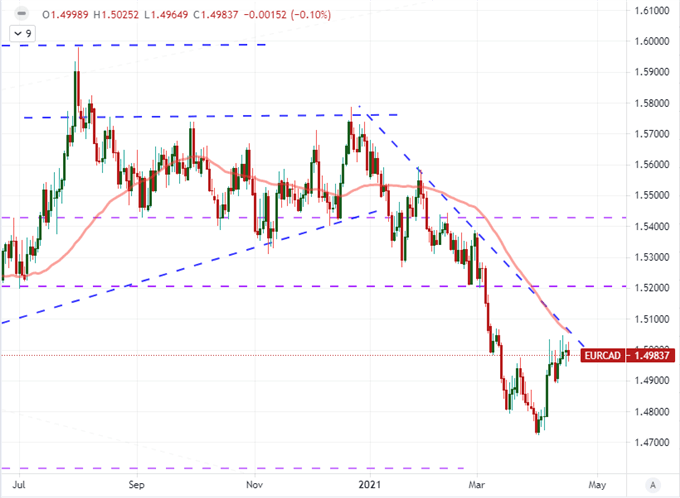
Chart Created on Tradingview Platform
Another group that may be more prone to abrupt market movement than the average market is the emerging market set. While the EEM Emerging Market ETF is a restrained picture tracking on benchmarks like international indices, the EM FX picture is much different. There are USDCNH and USDRUB which are embroiled in trade wars and diplomatic fraying respectively. More distinct, we have the USDTRY (Turkish Lira) as it tracks out its post-central bank reversal this past week or USDINR (India Rupee) reversing after an incredible breakout on a Reserve Bank of India fueled breakout and rally. Further in the BRICS, the South African Rand broke higher (USDZAR cleared support) with an eye to follow through and only the Brazilian Real (USDBRL) still building up pressure awaiting an ultimate conclusion of technical constriction. Volatility on charts of this magnitude is an unusual scenario so traders should monitor closely.
Chart of USDBRL with 50-DMA (Daily)
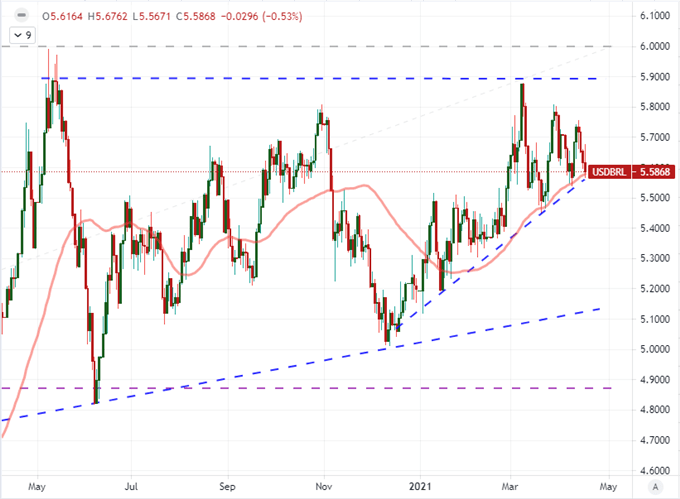
Chart Created on Tradingview Platform

.


