


S&P 500, Dow Jones, US Treasury Yields, Dollar and EURUSD Talking Points:
- Despite the S&P 500 ending this past week off at a record high and the psychology 4,000-mark so close at hand, risk trends seem less than confident of the drive
- Anticipation for Wednesday’s US infrastructure plan details, holiday conditions at the end of the week and quarter-end seasonal transition are likely weighing on conviction
- Stimulus-led growth forecasts are competing with signs of financial exuberance with the tickers hedge fund Archegos was forced to dump last week still not recovering

Risk Trends Struggle With the S&P 500 Starting from Record Highs
The new trading week began with serious assumptions as to the speculative charge that would unfold as liquidity filled. With US indices ended the past week on a strong bounce, it seemed the focus had shifted from inflation threatening central bank tapering to stimulus discussions bolstering growth forecasts. Yet, with the S&P 500 having already secured its technical record high close this past Friday, it is perhaps surprising that the benchmark floundered through Monday trade. The past day’s range was fairly broad, but no progress would be registered. That is particularly remarkable for the SPX given its proximity to the 4,000 mark. Why does this level carry any significance? Technically speaking, there is some Fibonacci extension in that area, but I believe the pull is more elemental than the chart extrapolations. Such a large, round figure is more likely to make its way into financial headlines which can rouse a larger swatch of market participation in a self-fulfilling prophy sort of way. While chyrons that trumpet when such a milestone is broken can be a powerful herd-based motivation, there is even more order activity (entries, stops, derivatives strikes, etc) that congregate in such areas before the wire is tripped.

Chart of S&P 500 with 100-Day Moving Average (Daily)
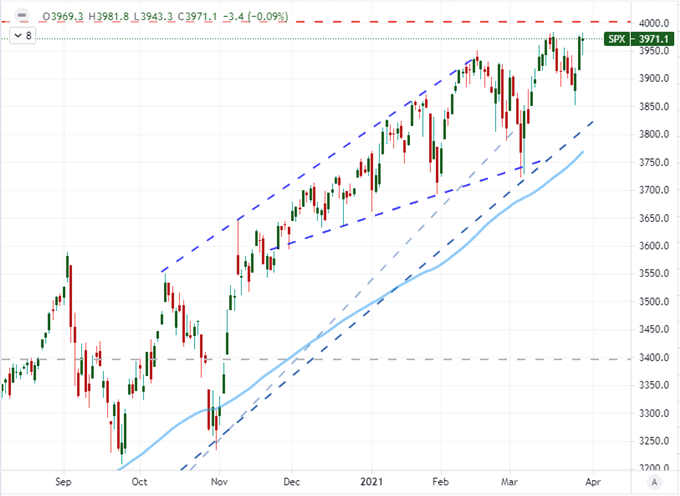
Chart Created on Tradingview Platform
As much as the pressure seems to be building for the S&P 500, the picture is different from some of the baseline’s peers. The SPX is one of the most ‘traded’ indices owing to the scale of exposure through financial products and measures like the SPY ETF, emini futures and VIX volatility index. It’s breadth and familiarity offer it a rarified status even among top capital measures. Yet, to start the week, it seems the blue-chip Dow has temporarily taken the spotlight with a push to fresh record highs above 33,170. Compare that to the until recently-favored Nasdaq 100 (the past year) which slipped slightly and is consolidating it a threat of reversal or the Russell 2000 (pacesetter the past two months) which stumbled fully -2.8 percent. This comparative shift reinforces a ‘rotation’ away from the online businesses and speculative geared meme stocks that were preferred during the pandemic height, towards the growth-centric firms. That is shift in preference, not necessarily a precursor to risk aversion. Nevertheless, there is a lot of speculative build up that could trip an avalanche.
Chart of Russell 2000 to Dow Jones Ratio with 100-Day Mov Avg and Dow Jones Average (Daily)
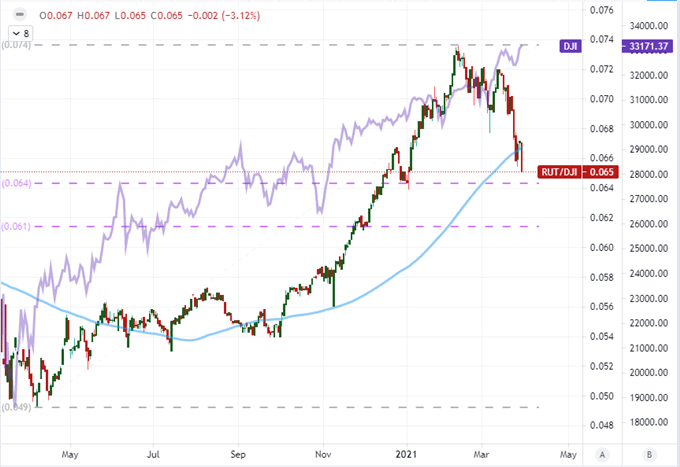
Chart Created on Tradingview Platform
Speculative Curbs to Keep Close Tabs On
One of the potential anchors to a full-blown speculative charge – bullish or bearish – this week are a series of seasonal considerations. The brakes can range from a short-term anticipation for the next session out to a few months ahead. Far more consistent for market impact from major event risk than the direction after its release or even the possibility of volatility post report is the curb in activity leading into the event. That is likely a factor at play leading into the scheduled update from President Joe Biden on the first phase of a potentially massive infrastructure spending program due Wednesday. Just a little further afield we also have the expected damper for liquidity through the end of the week associated to Good Friday holiday that will close many Western world markets. Pushing the timeline even higher, we are further heading into April starting Thursday, the S&P 500’s top calendar month for average returns with an accompanying drop in volume and volatility (VIX).
Chart of Seasonal Performance of S&P 500 with Volume and VIX
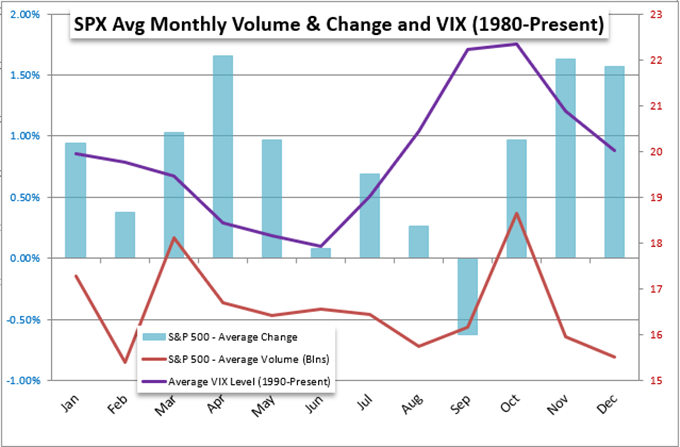
Chart Created by John Kicklighter with Data from Bloomberg Terminal
Thin markets can effectively temper the risk of strong trends regardless of direction, but that isn’t a guarantee. There are numerous concerns that I have over the circumstances backing our financial system at present. The extreme risk exposure built up on the basis of extraordinary stimulus has already triggered concern around inflation these past weeks. The degree of amplitude leading to the boil over in meme stocks and the rush to SPACs in order for businesses to raise capital without having to run the gauntlet of due diligence speaks to risky indulgence. Through the end of last week, the reports around forced liquidation of certain hedge fund Archegos Capital’s holdings flew under my radar. Considering the SPX was steady, there was limited reason for the macro watcher to come to the trouble seen in a host of Chinese tech stocks, ViacomCBS and Discovery among other tickers. While these are not systemically important on the scale we’ve discussed, what is concerning is the lack of recovery from these single names. If we are in a true ‘buy the dip’ environment, this would usually represent an opportunity such acolytes jump upon. Yet, these names are taking on further water. Beware the reflection of confidence this represents.
Chart of ViacomCB with 100 and 200-Day Mov Avg, 5-Day ROC and Discovery Inc (Daily)
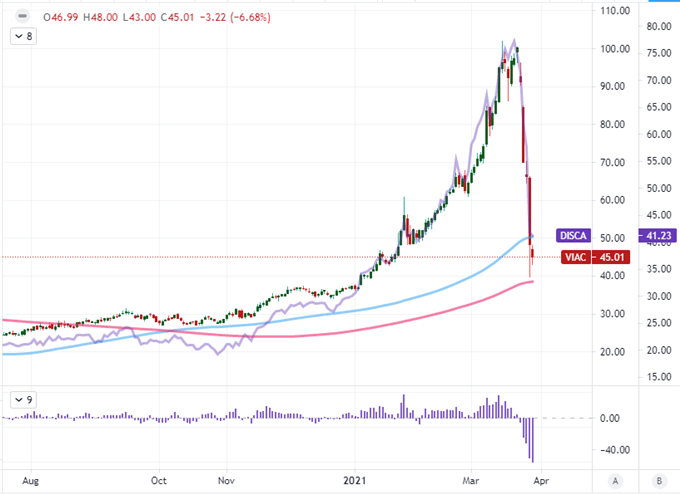
Chart Created on Tradingview Platform
Event Risk Over the Next 24 Hours Concentrates Potential on Dollar Based Majors
It will be difficult for the markets to generate a serious head of steam ahead of Wednesday’s US fiscal stimulus update, but it is not at all impossible. While the thematic issues could always have a high profile headline from out of the blue, my attention remains trained on the economic calendar. In the upcoming session, the top listing is the Conference Board’s US consumer sentiment survey. These have not been the most market-moving data points over the past months, but it is ultimately the convergence for expected inflation, growth and financial stability from the world’s largest collective consumer. Growth expectations have US 10-year yields back at 1.71 percent while the DXY Dollar Index advanced to four month highs. Is this a relative growth benefit? Perhaps there are interest rate expectations catering to its carry appeal? Or it could even be that an undercurrent of safe haven appeal is building up. Keep track of the currency’s developments relative to other benchmarks.
Chart of DXY Dollar Index and 100-Day Mov Avg with US 10-Year Treasury Yield (Daily)
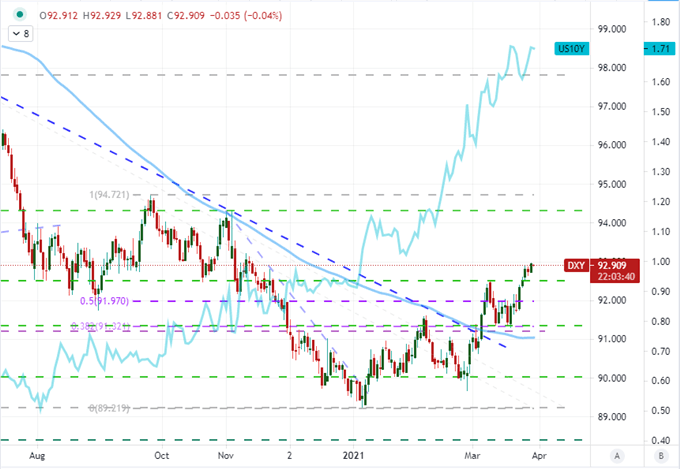
Chart Created on Tradingview Platform
For Dollar pairings, there is plenty of technical interest. EURUSD is the most common benchmark, but the 5-day ATR for the pair is the lowest in nearly 14 months. There is also a run of Eurozone sentiment data for March due. GBPUSD is interesting as it struggles to retake former support as new resistance at 1.3800 while vaccine conversations are ongoing. AUDUSD, NZDUSD and USDCAD are interesting for similar technical backdrop, but there is little clarity to interest or serious build up for traders to contemplate. USDJPY is a different story – not because it is a clearer bell for risk trends or relative performance but rather its technicals are remarkable. Having clear 109.25 late last week, we are now pushing the upper boundary of a multi-year wedge at 110. FX traders are watching very closely.

Chart of USDJPY with 100 and 200-Day Moving Averages (Daily)
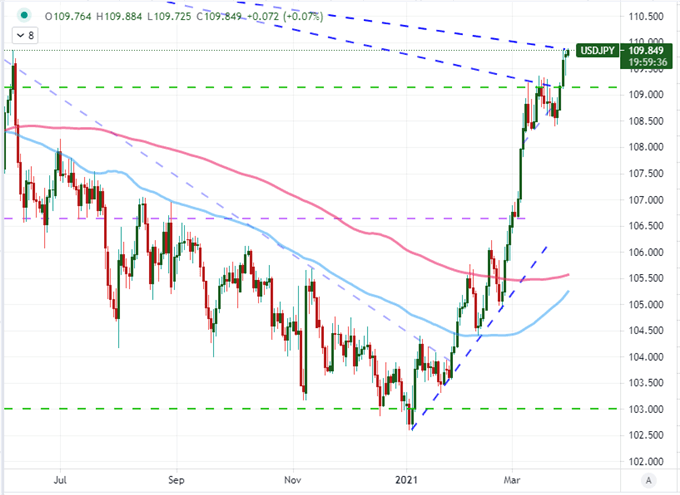
Chart Created on Tradingview Platform

.


