


S&P 500, VIX, EURUSD and USDCNH Talking Points:
- The S&P 500, a troubled risk leader, managed to close at a record high this past week; but it did so with what is often a reversal candle on the weekly
- A record high number of coronavirus cases in the US bodes poorly for growth which is likely why Donald Trump stated his administration would not shut the economy
- Event risk ahead can speak to growth as with USDCNH, but unpredictable systemic themes are likely the most potent charges ahead
A Bullish Bias on Risk Assets with High Rest-Rate Volatility and Threatening Technicals
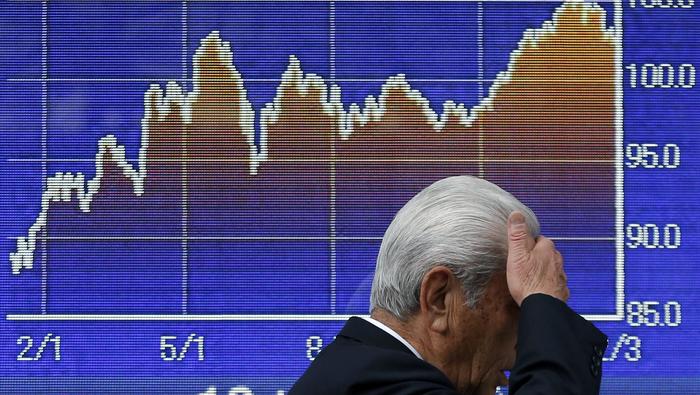
Risk appetite is offering up a mixed picture through this past week’s activities. An uncertainty in conviction isn’t exactly shocking with the US indices hovering near record highs at the same time growth forecasts darken and rates of return continue to drag modern day lows. Trends necessitate a collective belief in where the markets are heading against an idea of value – and a bullish drive with rising cost of entry is even more demanding of investors’ belief…or suspension of it. At the very pinnacle of risk appetite moving forward, I’m keeping tabs on the strength of the US tech sector relative to the broader equity market. Where the Dow held steady last week, the outperformance of the Nasdaq 100 took a meaningful blow. Is that simple moderation or the start of speculative immolation?
Chart of Nasdaq 100 to S&P 500 Ratio with 100-DMA and Overlaid with Dow
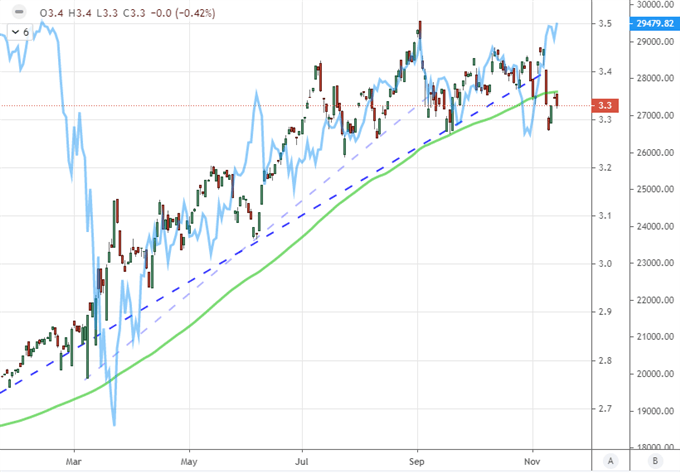
Chart Created on Tradingview Platform
Moving out to a broader picture of top performing sentiment benchmarks, the S&P 500 on a daily chart closed at a record high with Friday’s finish. Yet, over the entire week, the index ultimately finished little changed. In fact, my preferred measure of (lurid) risk appetite printed a weekly candle that stands as a prominent doji punctuating both volatility and indecision. With a gap on the open, the potential for an ‘evening star doji’ reversal starts to show through. Technical scope alone, however, should not set our expectations. There is an undercurrent of speculative bid still fleshed out by record or multi-year highs for so many benchmarks. On the other hand, range patterns are just as familiar across the horizon and the stakes for committing to a trend are unmistakably high.
Learn more about technical analysis in our DailyFX Education section.
| Change in | Longs | Shorts | OI |
| Daily | 1% | -1% | 0% |
| Weekly | 15% | -13% | -1% |
Chart of S&P 500 with 200-Day Moving Average, 10-Day Rate of Change an 200-Day Disparity (Daily)
Chart Created on Tradingview Platform
Distinct range barriers are one thing and the environment for unpredictability is something else entirely. Implied (expected) volatility doesn’t just reflect a correlation with risk aversion, it also represents a backdrop whereby direction and tempo can change with limited forewarning. While the popular VIX volatility index may be significantly off its March pandemic highs, it is still holding fast above its historical average. In fact, with Friday’s close, the measure is 185 trading days above 20.
Chart of VIX Volatility Index (Daily)
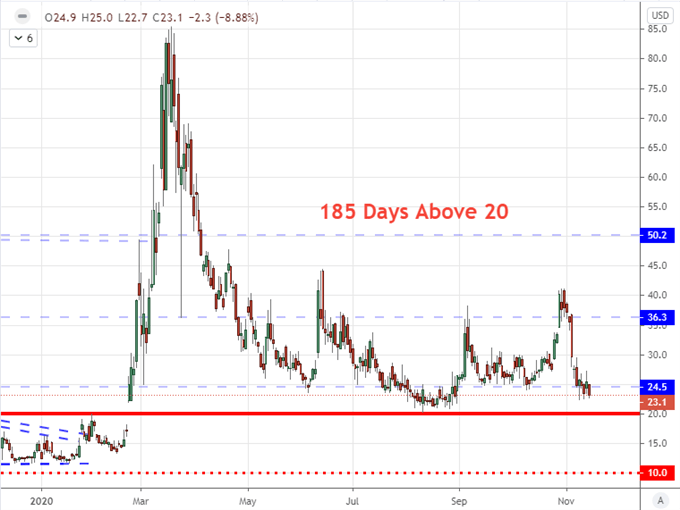
Chart Created on Tradingview Platform
The Systemic Themes to Track: Government Transition; Coronavirus, Stimulus, Growth
To keep track on the threat map for what can upend the complacent risk bid, the question of US government stability has been dialed back to a buzz. This past week, the Trump administration dropped its lawsuit in Arizona, lost suits in Michigan and Pennsylvania, and saw Georgia call for Joe Biden. Trump has yet to concede but his language Friday seemed to suggest he seems to recognize the course. The first update in two weeks from the outgoing President was on the state of the coronavirus where he reiterated that his administration would not shutter the economy in the face of record cases of infections nationwide.
Chart of US Confirmed Coronavirus Cases (Daily)
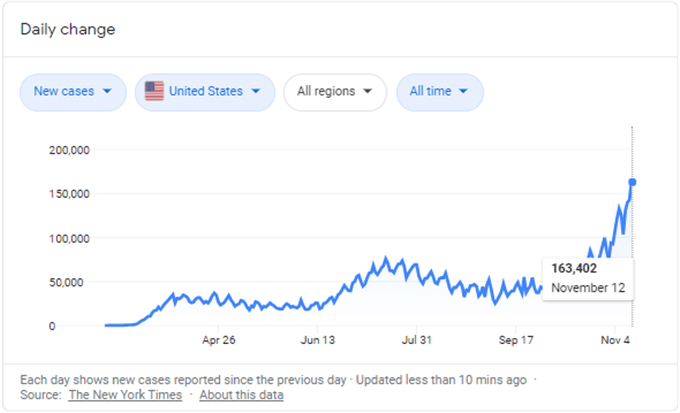
Chart Created onGoogle with Data from The New York Times
The trajectory of coronavirus cases between economies can factor into exchange rates and relative market health. Markets are amoral when it comes to the human toll this blight is exacting, but there is also an economic calculation that the movement of capital will factor. If it were purely a difference in trajectory of infection rates, AUDUSD could be a strong bullish study. Instead, there are factors of which countries are throttling their economies as a by-product of curbing the spread along with what stimulus is being employed to offset the burden. This is where EURUSD continues to represent one of the more fundamental complicated pairs – but also the most important as a barometer.

Chart of EURUSD with 200-Day Moving Average, 80-Day Range and 10-Day ATR (Daily)
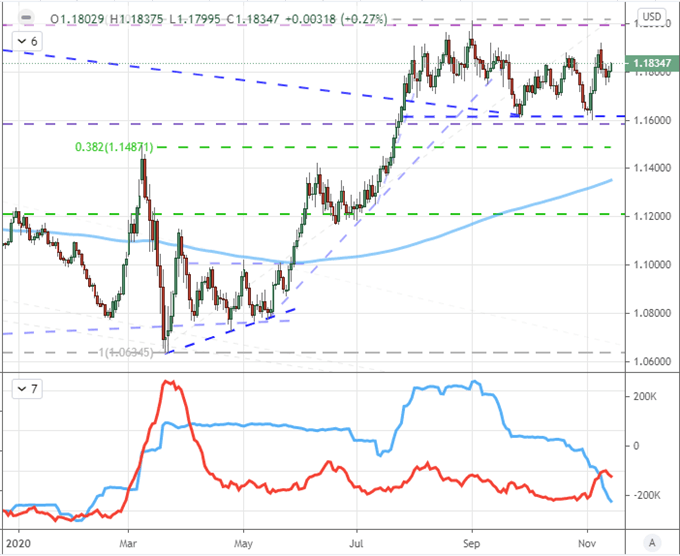
Chart Created on Tradingview Platform
Honorable Mention Markets to Watch: USDCNH and NZDJPY
Outside of broad risk trends and systemic fundamental weather patterns, there are a few direct markets that I would highlight for their own appeal as well as their ability to signal for the wider market. USDCNH isn’t the first pair people think of when they evaluate the FX market, but it speaks to a number of key issues such as the aforementioned Covid comparison and matters like trade wars. Yet, something more rudimentary may be on tap to start this week as the US and Chinese economic docket both hold important growth-oriented data to start this coming week including retail sales and industrial production from each economy. Watch closely.
Chart ofUSDCNH with 50-Day Moving Average (Daily)
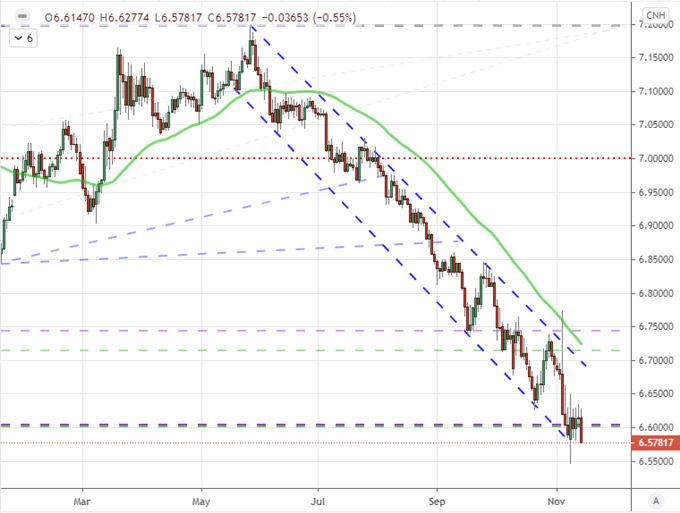
Chart Created on Tradingview Platform
Another pair that will pull together fundamental themes while also aligning to technical considerations – a key consideration for me when evaluating markets – is NZDJPY. This pair is a traditional carry trade cross, but yield is all but vanished. There is still a risk sensitivity, but the exchange rate is less likely to follow ‘risk on’ unless it is overwhelming but the opposite bearing is more likely to drag the market along. An additional fundamental factor is the New Zealand currency’s liability to the RBNZ maintaining an extreme dovish policy stance despite the general swell this past week – supposedly on the recognition that they didn’t commit to negative rates – and the density of the chart’s range looks provocative.
Chart of NZDJPY with 200-Day Moving Average (Daily)
Chart Created on Tradingview Platform

.


