


Nasdaq, S&P 500, EURUSD, USDCAD and EURGBP Talking Points:
- Following a -7% slide for the S&P 500 and -11% tumble for the Nasdaq, the indices put in for their biggest single-day rallies since Jun 5 and Apr 29 respectively
- While the ‘buy the dip’ mentality is a powerful speculative elixir among the long-complacent, volatility remains the overbearing concern in the financial system
- Fundamentally, the US government’s inability to approve a stimulus program paired with the ECB’s upcoming rate decision makes EURUSD a pair to watch
A Glimmer of Hope for Speculative Bulls That Don’t Have a ‘Plan B’
After three days of heavy selling, my preferred benchmarks for ‘risk appetite’ finally put in for a breather this past session. The bounce was a broad one stretching from the S&P 500 to global equities to other risk milestones (emerging markets, high-yield fixed income, carry trade and commodities among other metrics). That said, my focus through this seasonal transition from holiday conditions to an active fall trade remains on the backdrop for liquidity and volatility. Amid heightened volatility – which is normal in September – abrupt changes in direction are a greater risk. While we can monitor the ‘bleeding edge’ of speculative intent from the likes of Tesla, Amazon, Apple and other high-profile tech players; the situation is encompassed nicely by the Nasdaq 100’s -11 percent tumble through Tuesday’s close followed by this past session’s 3 percent recovery. Is there a prevailing view for this market?
| Change in | Longs | Shorts | OI |
| Daily | 1% | -1% | 0% |
| Weekly | 15% | -13% | -1% |
Chart of Nasdaq 100 with 20, 50-Day Moving Averages, 1-Day ROC and 5-Day ATR (Daily)
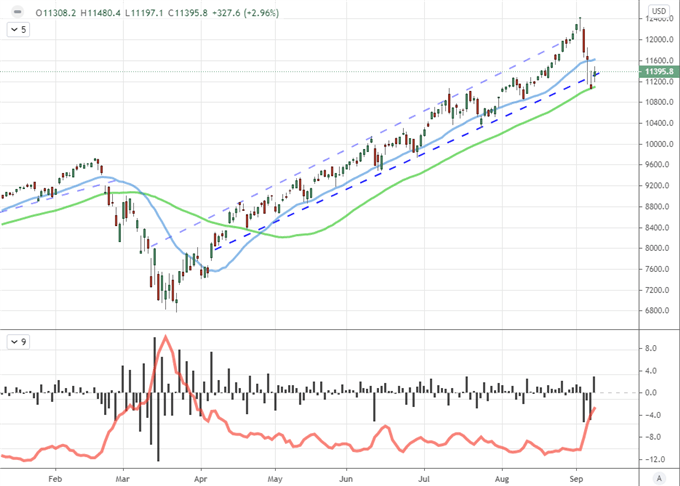
Chart Created on Tradingview Platform
When gauging the undercurrent for speculative drive, my focus is typically drawn to a combination of intensity and correlation across risk-leaning benchmarks. In that case, there was little mistaking the bounce from a range of speculative pace setters Wednesday – indicating a breadth in sentient. However, conviction also draws from conviction which can be seen technically as follow through. One day in a new direction does not make a trend, but the general course for approximately the past six months has bas been unabashedly bullish. Reasoning to this drive, however, has been called into question every step of the way as the assumption of a ‘V-shaped recovery’ has been long steeped in skepticism. Ultimately, the backdrop of heightened volatility and the fundamental minefield we are walking through leave me watching for any signs that the floor has dropped out from underneath the markets once again.
Learn more about the three types of general Forex market analysis in our education section.
Chart of Risk Trend Intensity
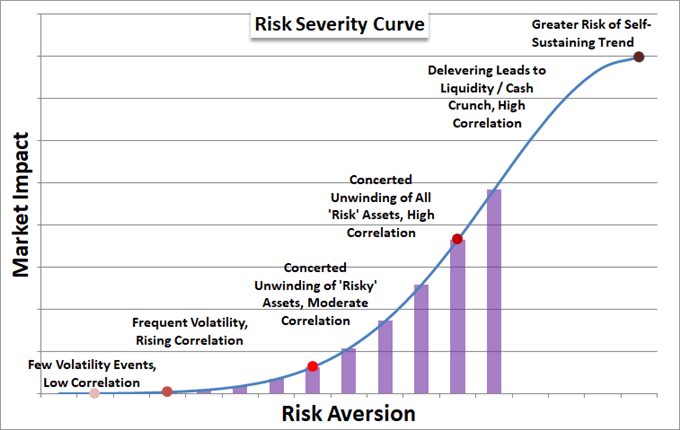
Chart Created by John Kicklighter
‘Buy the Dip’ Mentality is Fighting Against Systemic and Seasonal Agitation
Through the underlying trend of the past half year and decade have ultimately held a bearish course, I have maintained an overall bearish view on risk markets these past few years. That said, being bearish does not mean taking active exposure against momentum. Committing to skepticism against a prevailing trend is a particularly low probability endeavor that is attempting to pick tops in in the best case scenario and project a ‘moral’ sense of value on an irrational mass in the worst case. Markets can and do diverge from textbook measures of fundamentals for extended periods. This has happened so often in the past years, that a familiar refrain has echoed through social media accounts of individual traders: “BTD!’ (or ‘buy the dip’). I asked Twitter followers after the US close this past session how confident they were in this bounce from the steep pullback. It remains that close to two-thirds believe it is a temporary reprieve in a more progressive retreat.
Chart of Speculative Positioning in S&P 500 CFDs from IG (Daily)
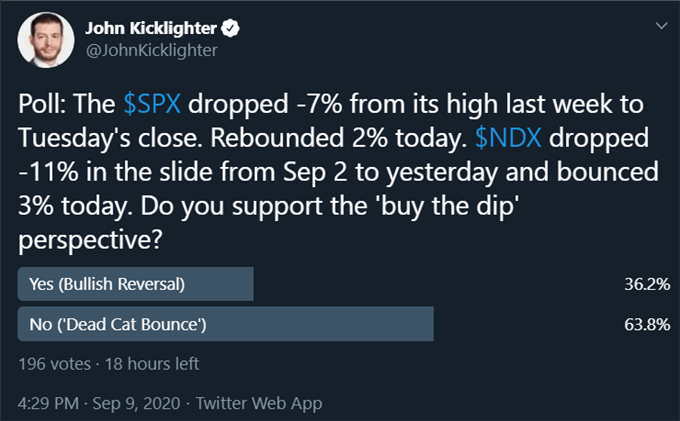
Poll from Twitter.com, @JohnKicklighter
The Fundamental Acumen of EURUSD
Moving forward, my top concern is the backdrop for market conditions. The quick shift in volatility creates a very different environment which could be further compounded if there is more evidence that liquidity is filling out as quickly as en vogue assets as the Nasdaq ETF (QQQ). That said, we are not totally dictated by the amorphous view of mass sentiment or the tech milestones for favored indices and benchmarks. Fundamentals still play a key role. On the systemic side, stimulus is playing an unspoken but critical role in current stability. For US markets just days off record highs, we have seen fresh news that Democratic leaders are ready to reject the GOP-led, $300 billion targeted stimulus program meant to bolster the expired CARES act. That isn’t exactly surprising, but it still holds serious implications for such a stretched speculative position.

Chart of DXY Dollar Index with US-German 10-Year Yield Differential (Daily)
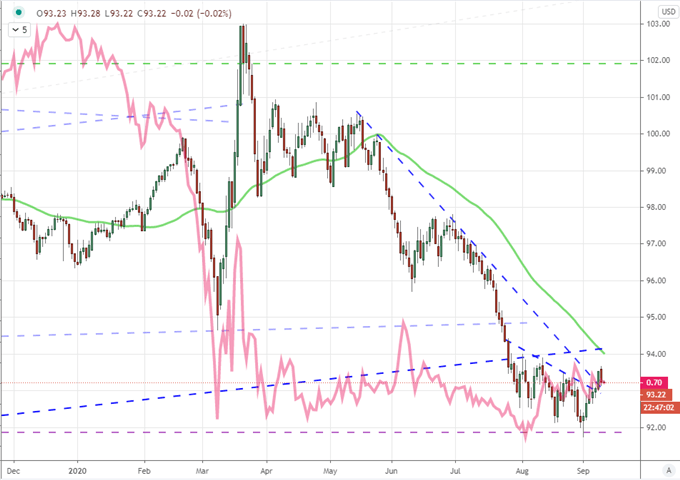
Chart Created on Tradingview Platform
While the quick evaporation of fresh stimulus from the world’s largest economy didn’t seem to impact US indices, it seems to have certainly added another reason to trip up the Dollar’s recovery effort. The relative insight from the Greenback can amplify the influence of certain systemic matters that are conveniently downplayed by speculative complacency. That relative perspective will come into play once again in the upcoming session with the ECB (learn more about the European Central Bank in our education section) rate decision on tap. The group is not expected to change its policy mix but the recent downshift in pace from regional data has many traders worrying what is ahead. Will Lagarde and Co address these concerns or let them fester?
Chart of EURUSD with Euro Volatility Index (Daily)
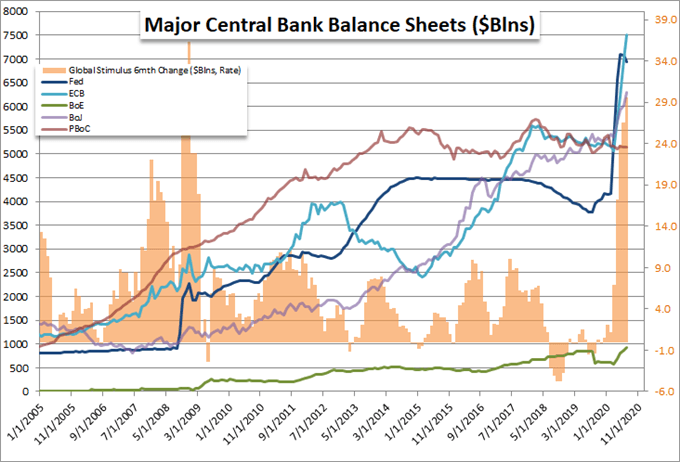
Chart Created by John Kicklighter with Data from Fed Economic Database
Trade Wars and Monetary Policy are Key Themes for Thursday
Among other fundamental themes of merit for systemic value and explicit volatility risk, trade wars remains a topic that I believe holds more sway over the markets than is currently being accounted for. While the US-China standoff continues to escalate slowly, the deteriorating language in the EU-UK negotiations of a post-Brexit trade deal are hard to miss. Indeed, Sterling traders haven’t missed the warning shots. GBPUSD has dropped and EURGBP rallied as the Internal Market Bill from Prime Minister Johnson’s government has been interpreted as admission that the UK was willing to breach a portion of its Brexit deal. Is this a genuine tactic or merely pressure building to urge further compromise? The market is paying close attention.
Chart of EURGBP with German-UK 10-Year Yield Differential (Daily)
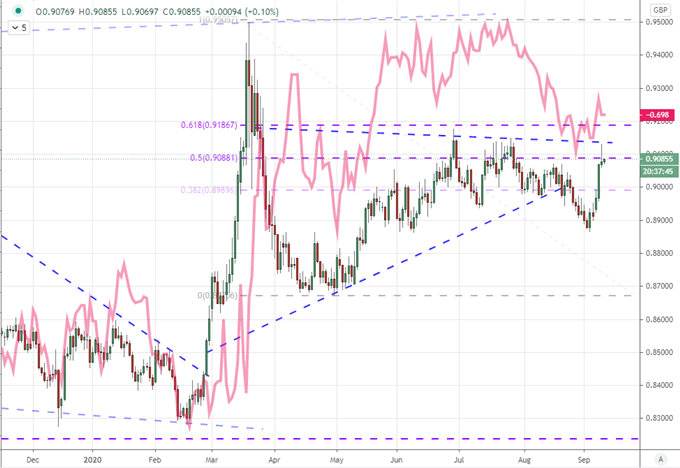
Chart Created on Tradingview Platform
Meanwhile, monetary policy isn’t just relegated to the ECB’s next move. The Bank of Canada (BOC) didn’t alter its policy mix this past session when it announced its course, but that is itself meaningful. The tempering of recovery globally is putting external forces of support in a critical position to offer more support. Will Canada’s central bank step up to fortify its economy in the near future? BOC Governor Macklem is due to speak later today. We may find an answer to that question/concern.
Chart of USDCAD with 20 and 50-Day Moving Averages (Daily)
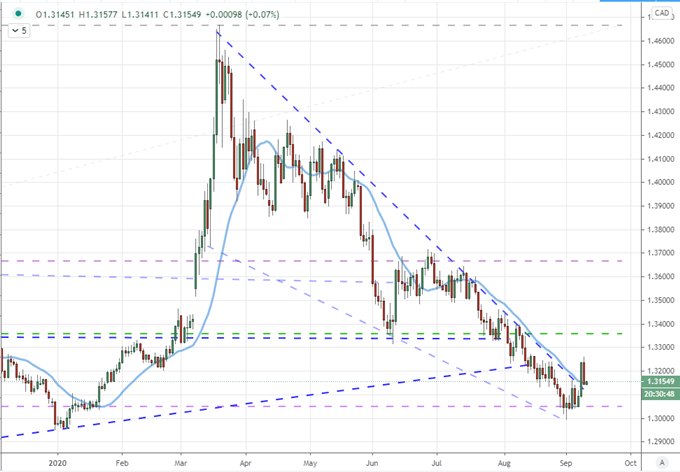
Chart Created on Tradingview Platform

If you want to download my Manic-Crisis calendar, you can find the updated file here.
.


