


Dollar, EURUSD, AUDUSD, Nasdaq Talking Points:
- The long holiday weekend for the US didn’t seem to settle nerves following last week’s surge in volatility with selling pressure intensifying and spreading
- While the S&P 500’s drop below 3,400 looks like a key break, it is not as clear where the tipping point for the Nasdaq, EEM and other risk benchmarks may be
- Though a traditional safe haven, the Dollar’s edge higher doesn’t register full risk aversion – nor does Gold, but Yen crosses are conforming
WEBINAR|918434995|Join our DailyFX Summit Day 2 discussion on indices
Risk Aversion Isn’t Succored by the Weekend Liquidity Break
There was a ‘fire break’ in the speculative drawdown that was starting to earnest threaten investor confidence through the end of the pace week. In addition to the natural assumptions around holiday trading conditions at the end of the ‘summer doldrums’, the weekend liquidity drain is a natural anesthetizer for underdeveloped risk appetite trends. And yet, the US markets opened with the Tuesday session with the same intensity of risk aversion and volume as what we left off with Friday. I am keeping tabs on appetites at the peak of speculative actions: from Tesla to FAANG to the Nasdaq to the S&P 500 to more ‘tame’ measures of speculative appetite. TSLA dropped a record-breaking -21% this past session while the Nasdaq slide a troubling -4.8% and the broader S&P 500 trailed the dumping effort with its own -2.8% slump. There is serious selling pressure here. As bias and market conditions shift, the threat of a self-sustaining selloff grows. The question I have is: what technical catalysts will start the fire for speculative immolation?
| Change in | Longs | Shorts | OI |
| Daily | 1% | -1% | 0% |
| Weekly | 15% | -13% | -1% |
Chart of Nasdaq 100 with 20, 50-Day Moving Averages, 1-Day ROC and Wicks (Daily)
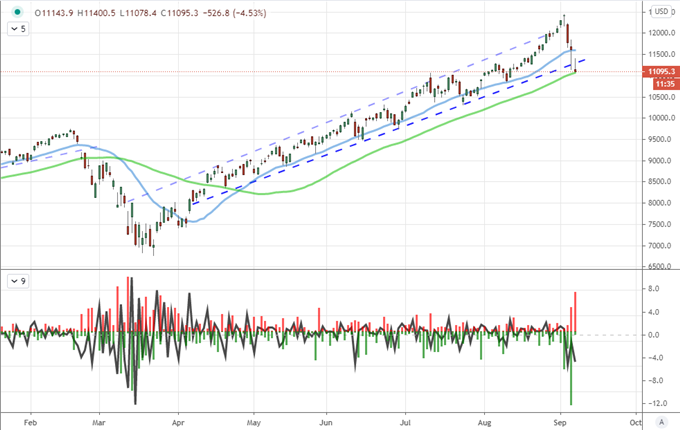
Chart Created on Tradingview Platform
‘Risk aversion’ is a minimal yet interpretative concept. For many of the new market participants over the past year who have jumped into thematic trading and pursed the top performing asset class (US tech shares), performance seems to be a determined by the likes of FAANG members or even Tesla. Yet, there is serious assumption built into this generalized assessment. Markets have deviated far from underlying economic health and maintaining this discrepancy requires considerable outside influence. Central banks are running low on tools and governments are clearly not up to the task of shouldering the burden. If the world’s investors decided that global monetary policy groups have reached the end of their arsenal, we would very likely see confidence collapse. What qualifies full-bore risk aversion: my preferred measure is intense selling across a host of otherwise, unrelated sentiment measures (US and global indices, emerging markets, junk bonds, commodities, etc).
Learn more about the three types of general Forex market analysis in our education section.
Chart of Risk Trend Intensity
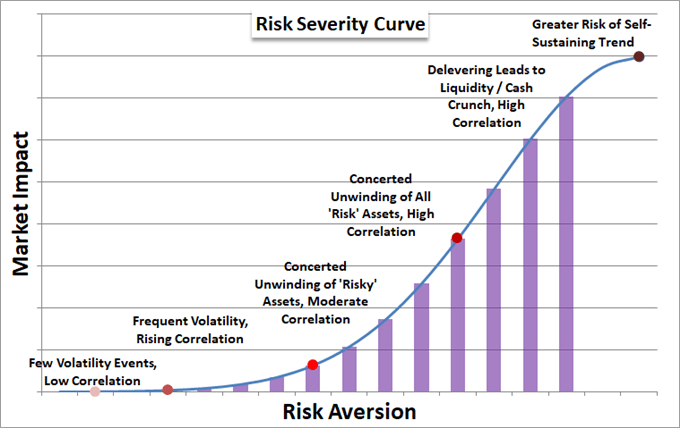
Chart Created by John Kicklighter
‘Buy the Dip’ Mentality is Fighting Against Systemic and Seasonal Agitation
As the speculative measures begin to struggle, I’m keeping close eye on any disparity in market ‘words’ and ‘actions’. In the past year, a new – but familiar – market participant started to gain serious traction in representation. The new-to-trading crowd has been drawn in by a robust bull market where throwing in with momentum seems to be a straightforward approach while new financial products make access a far more democratizing element. This is leading to what is often considered a ‘buy the dip’ mentality whereby all pullbacks are considered opportunities by those only familiar with a persistent bid through short lived bouts of tumult. We can see that mentality coming through in the IG client sentiment figures which has a significant drop in short interest with the recent slump. Is this really the end of the pullback?
Chart of Speculative Positioning in S&P 500 CFDs from IG (Daily)
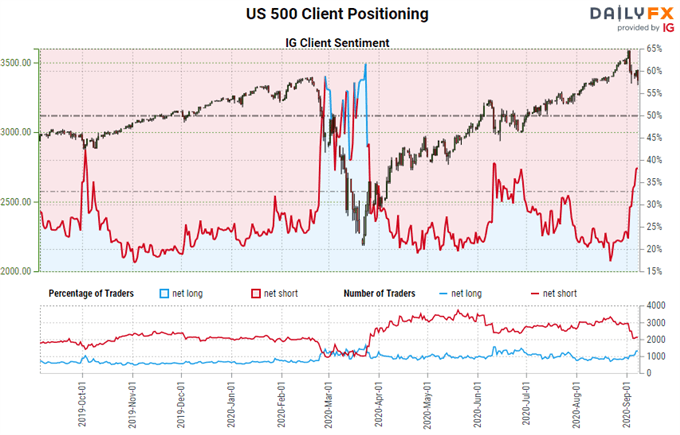
Chart from DailyFX.com
Looking for motivation for the recent selloff in technical and fundamental outlets makes sense. I am considering both metrics myself. However, I believe general market conditions can play a far more significant roll. Whether or not a technical break leads to strong follow through or event risk can stir greed/panic depends on the backdrop conditions of the financial system. I will point out that this past session risk aversion was making strides in a wide range of assets with an accompanying rise in volume for favorite assets for those looking to ‘ride the wave’. Volume on the QQQ Nasdaq ETF for example was sharply elevated for a third straight day, aligning darkly with the index itself.
Chart of QQQ ETF with Volume and VIX in Orange (Daily)
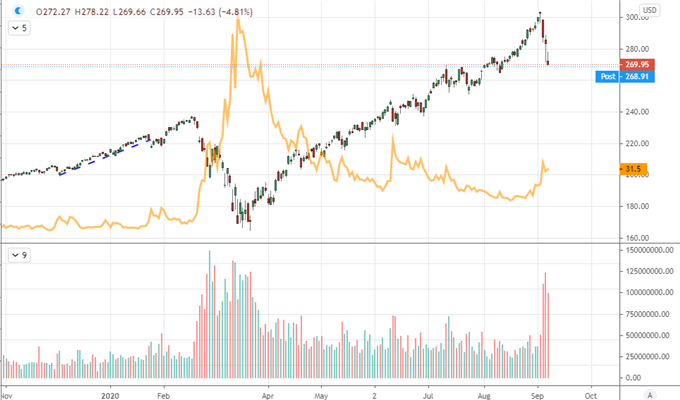
Chart Created on Tradingview Platform
Meanwhile, the Dollar and Pound Are Starting to Move
Ultimately, collective risk trends are my number one concern. When momentum behind speculative intent starts to catch traction, it can readily override any minor differentiating factor across regions or asset type. I would point out that risk aversion seemed to reach quite far this past session. That said, favored safe havens were not making a material land grab amid the rising uncertainty. Gold held the line at 1,900 while the Dollar was only crawling above resistance. The DXY Dollar Index eased above 93.25, which aligned to EURUSD’s drop below 1.1800 among other keys. Yet, I don’t think the technical cue from this favorite index nor pair were potent enough to generate their own gravity.

Chart of EURUSD with Euro Volatility Index (Daily)
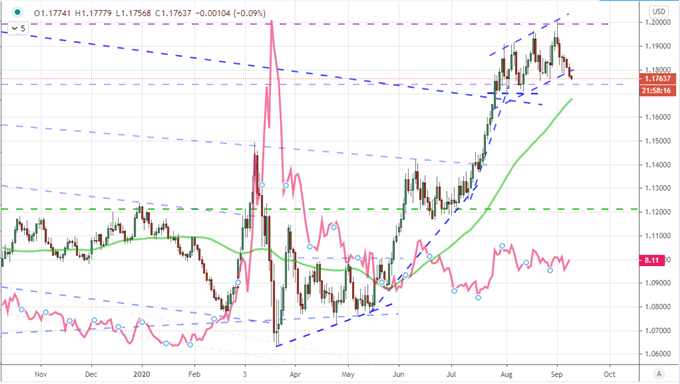
Chart Created on Tradingview Platform
In looking for follow through from the Dollar’s attempted recovery, it is best to align USD to a currency that faces considerable headwinds. There are few better counterparts than the Australian Dollar. AUDUSD has swelled following the March swing low-reversal despite severe Australian economic hardship, a resurgence in coronavirus cases and a deterioration in relations with China. AUDUSD is my first focus around 0.7200 but there are plenty of crosses that are worthy of consideration if conditions continue to deteriorate.
Chart of AUDUSD with 20 and 50-Day Moving Averages (Daily)
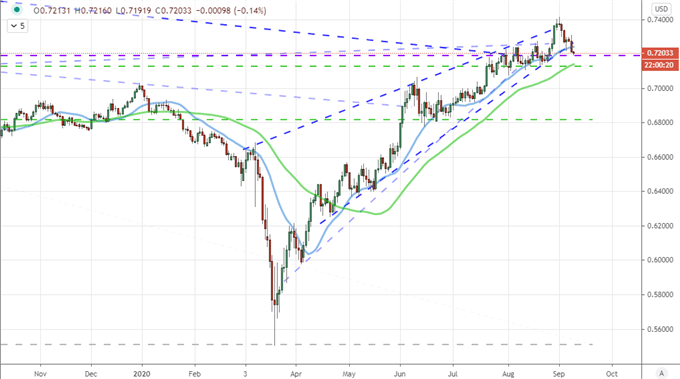
Chart Created on Tradingview Platform
Another Dollar-based pair that should be watched closely into the upcoming session is USDCAD. On the technical side, it has just recently broken the descending trendline resistance that has carried the post-pandemic peak reversal. This is a timely development for the Loonie given that the Bank of Canada (BOC) is due to weigh in on its own monetary policy today. Will they help fuel this pair’s rally or can they alternatively cut it down in its liftoff? We will know soon.
Chart of USDCAD with 20 and 50-Day Moving Averages (Daily)
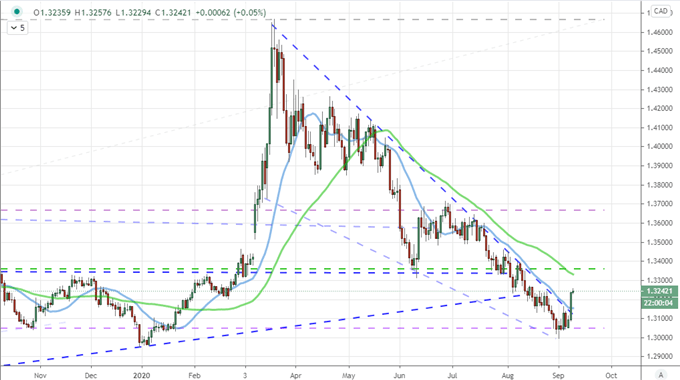
Chart Created on Tradingview Platform

If you want to download my Manic-Crisis calendar, you can find the updated file here.
.


