


Nasdaq, S&P 500, Dollar and USDCNH Talking Points:
- The S&P 500 and Nasdaq exerted critical pressure on risk trends through the end of this past week, but both managed to avoid critical breakdowns
- While volume and conviction is often restricted through the opening weeks of September, we may find the expected seasonal transition play out earlier
- Key levels on my radar are the 3,400 for the S&P 500, 1.1700 for EURUSD and 1,920 for Gold
Risk appetite received a serious jolt through the end of this past week. Is the typical seasonal transition from summer doldrums expected from August into a materially more active September already under way? Or is still-thin liquidity acting as an amplifier for errant volatility? The week ahead of us will go a long way in determining conviction across the speculative rank. While I am still of the belief that caution is warranted until there is deeper conviction in risk aversion through intensity and breadth of deleveraging efforts, there was plenty in this past week that should raise concern. This past Thursday experienced an extraordinarily sharp selloff in leading risk benchmarks – from darling Tesla to the tech-heavy Nasdaq 100 to the broader S&P 500 – but the fire ebbed somewhat Friday. Yet, while we avoided critical breakdowns for the likes of the Nasdaq (11,000) and S&P 500 (3,400); the surge in volatility in speculative favorites speaks to an environment conducive to transition.
| Change in | Longs | Shorts | OI |
| Daily | 1% | -1% | 0% |
| Weekly | 15% | -13% | -1% |
Chart of Nasdaq 100 with 50-Day Moving Average, 2-Day ROC and 1-Day ATR (Daily)
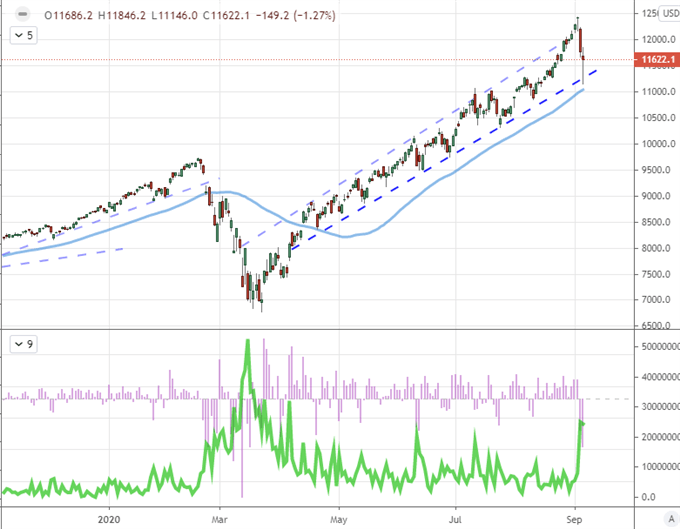
Chart Created on Tradingview Platform
While I follow technical and fundamental analysis with an appreciation of a hierarchy of influence among various speculative benchmarks; one of my top measures of speculative conviction is the combination of correlation and intensity of movement in key risk-sensitive measures – such as the S&P 500, global indices, emerging markets, ‘junk bonds’, carry trade and more. Through the Nasdaq’s -5.2% drop on Thursday and two-day -6.4% drop through Friday’s close, there is upheaval that can register among the most inexperienced market participants. Given the concentration of appetite in the likes of FAANG members and the tech-heavy indices, that is a serious threat.. However, to tip the scales to full speculative deleveraging, a run on all things billed speculative fodder is a far more menacing sign. We started to see the signs lean in that direction through end of week, but not enough to override the comfort found in an extended weekend liquidity drain.
Learn more about the three types of general Forex market analysis in our education section.
Chart of Risk Trend Intensity
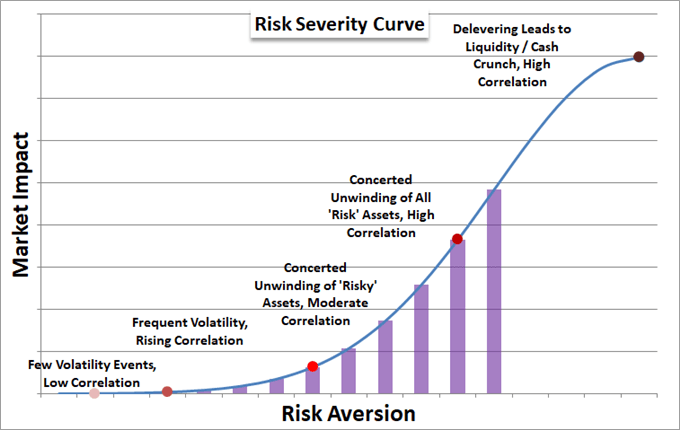
Chart Created by John Kicklighter
What is Driving and Will Drive Markets
Looking out to the start of the new week, there is a material gap in the transmission of panic that could otherwise grow out of this past week’s volatility. The US holiday on Monday will act as something of a firebreak for volatility to simply jump the weekend liquidity drain. It is of course possible that global markets sell off without the New York session to start the new week, but that would certainly be the exception to the rule – and I’m a probability person. Come Tuesday, liquidity is not only restored for the week, but it will further pick up the seasonal expectations. As we revisit the technical boundaries and fundamental themes that are due to pick up the responsibility of market enthusiasm, I would like to point out the unusual prioritization of concerns seen in search habits. If we were to refer to Google for financial news interest in the United States, interest in ‘Tesla’ has significantly outstripped search in ‘Covid’ and ‘recession’. That should speak to misaligned priorities and pressure for risk rebalancing.
Chart of Google Search Ranking for ‘Tesla’, ‘Covid’ and ‘Recession’ (Weekly)
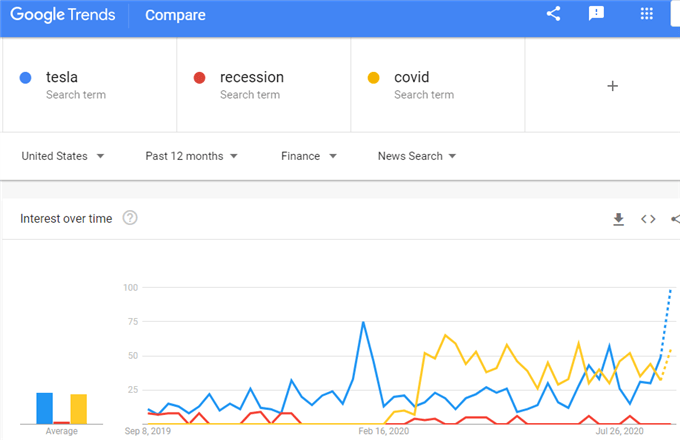
Chart from Google Trends
Where liquidity, bias and sensitivity to volatility are what I consider ‘market conditions’; fundamentals also have their place in developing market bearings. Through the end of this past week, we tapped into one of the more ubiquitous themes that can steer long-term investor confidence: growth potential. The Friday NFPs fended off ADP-level disappointment, but the figure’s 1.37 million net jobs added back to the economy still represents a long recovery ahead to reverse the job losses earlier in 2020. If a sharp recovery in the global economy is a necessary milestone to an extended market run, we may very well find ourselves in some spot of trouble. For outright health data, the US economic and sentiment surveys are a few figures holding significant scope, but I place full conviction upon these figures along.
Chart of S&P 500 with Manufacturing and Services ISM Surveys (Monthly)
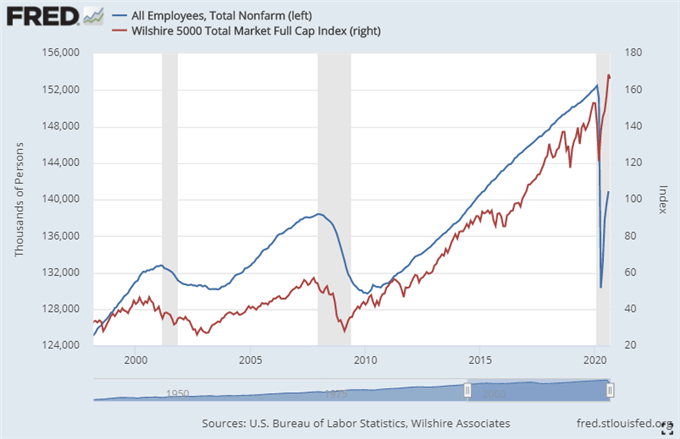
Chart Created by John Kicklighter
The Relative Drivers in EURUSD, USDNH and even Gold
While my attention is firmly fixed on general risk trends ahead given the scale of buildup in the financial system around this belief in external stabilizers, relative considerations should be another factor to gauge for opportunity and even inference for general market sway. EURUSD is perhaps at the top of my list as the most liquidity ‘asset’ in the world. It also happens to reflect the relative appeal between the world’s two largest economies and the effectiveness of two aggressive central banks. Thus far, the pair has held the line at 1.1800 – and I consider 1.1700 more important – but I am watching EURUSD for not just a basic risk view but also its implications for liquidity havens (a severe measure of risk trends).

Chart of EURUSD with Euro Volatility Index (Daily)
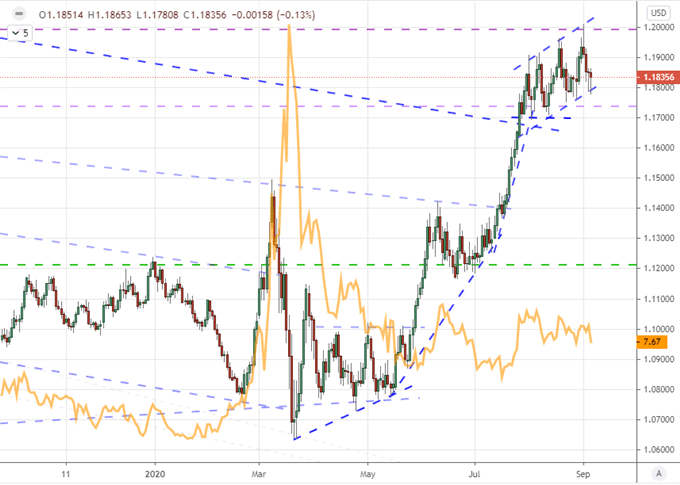
Chart Created on Tradingview Platform
Risk trends is my first and top concern moving forward. Second to that, we have the convenient downplaying of the sharpest recession since the Great Depression. Should investors chose to pay attention to that data, we could find ourselves in a seriously unstable position. Yet, there are some other matters of importance that should be tracked. Monetary policy competition and effectiveness is one such matter with the ECB and BOC rate decisions ahead. Growth is an assessment to be drawn out of ancillary figures like the IBD’s economic sentiment survey. Another matter that has eased in influence recently but has been a serious concern is the state of trade wars. Chinese state media suggested further Treasury selling could be ahead while US authorities reportedly considered blacklisting the country’s number one chip maker: SMIC. While there is a lot going on in numerous corners of the system, monitoring USDCNH seems wise from a global macro perspective.
Chart of USDCNH with China Volatility Index, Consecutive Candle Count and 6-Week ROC (Weekly)
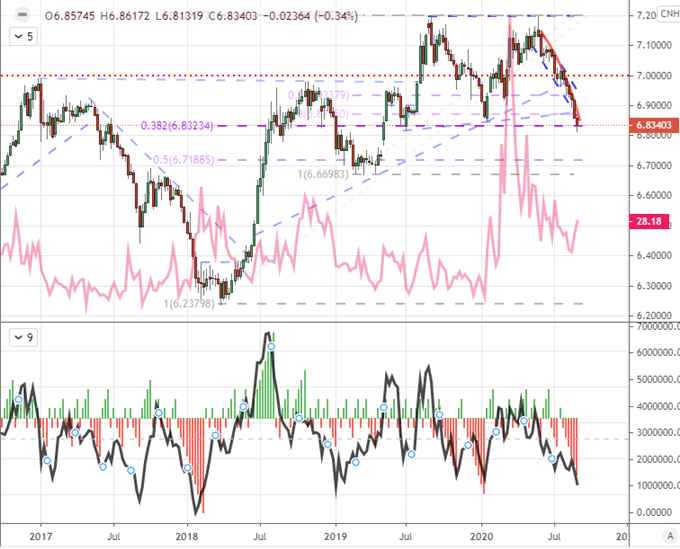
Chart Created on Tradingview Platform

If you want to download my Manic-Crisis calendar, you can find the updated file here.
.


