


S&P 500, Dollar, GBPUSD, NZDUSD Talking Points:
- Despite a return to general risk appetite, there wasn’t a full commitment from the speculative rank – neither in S&P 500 record highs or in breadth of drive
- The Dollar’s rally has faltered without a clear US stimulus drive to replace the executive orders and vaccine talk has offered little supplement
- Neither the New Zealand Dollar nor British Pound would commit to last unwind despite serious fundamental troubles, what potential is there in other outlets?
Risk Appetite is More than a S&P 500 Record High
We are on the cusp of a record high for my preferred, imperfect measure of risk appetite: the S&P 500. Tuesday offered the first bearish close for this benchmark in 8 consecutive trading days, but the overdue pace disruption clearly would not signal the full reversal of course some eager bearish interests would proactively extrapolate. Historically speaking, a red candle after a period of seven or more consecutive days’ advance has not favored a full trend reversal. Rather, it has acted as a technical short-circuit of an impressive technical charge; and this situation seems no different. As we stand on the cusp of a single day’s ATR of a record high for an index that has led speculative appetite over the past decade, it is perhaps expected that default bulls will see an unrelenting charge and the backdrop for the next leg higher. However, rousing conviction in a stretched market is just as impractical – if not more so – than extrapolating a full-tilt bear trend in a single day’s slide.

Chart of S&P 500 with DAX and 20-Day Rolling Correlation Coefficient (Daily)
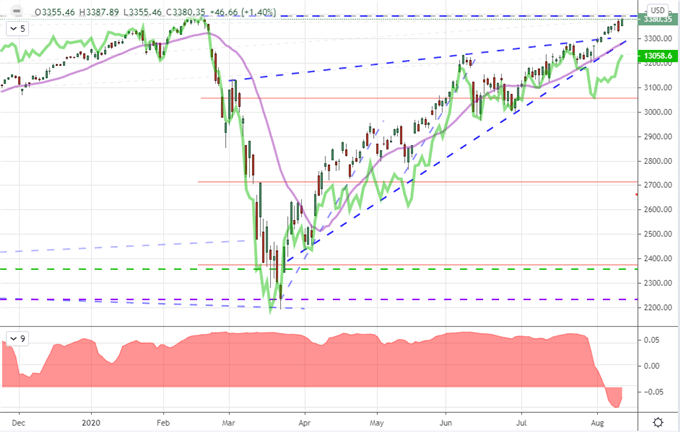
Chart Created on Tradingview Platform
Besides the impractical nature of inferring a substantive leg higher from an already stretched market in a mere wobble in an otherwise quiet market, it is worth noting that there remains an uneven backdrop for speculative pacing across the speculative spectrum for asset classes. The 20-day rolling correlation between the SPX and German DAX for example is still in the rare position of an inverse relationship. Other measures that I like to refer to as a gauge of general sentiment are not exactly in retreat, but they are certainly falling far short of the conviction of the US indices. Lately, there has been a frequent refrain among hopeful bullish interests that the next phase higher can be fueled by ‘money on the sidelines’ that can be drain back into the market with some sort of prompt – a fresh record high or a top off on stimulus. I maintain, however, that inspiring investment on assets that are pushing fresh record cost of entry is not as enticing as those looking to justify the bias may suggest.
Chart of Ratio Nasdaq to Dow with 3-Day Rate of Change (Daily)
Chart Created on Tradingview Platform
What is Driving Gold – A Related Consideration for Risk Assets
On a similar narrative to the general state of risk trends via capital markets, gold’s incredible tumble Tuesday seems to still draw as much confusion as it does interest. The more than five percent plunge through that session was the sharpest loss since the April 2013 market crash, which naturally rouses expectations that this has a systemic genesis – whether on an underlying basis or practical positioning. From my poll, it seems most believe the dive was a reflection of rising yields. Treasury and other government bond yields did edge higher, which could be interpreted as confidence in growth, drop in stimulus or perhaps a rebound in appetite for fiat. However, reality of recession forecasts, the commitment of central banks and the state of fundamentals dampens that viability in my book. It is important to consider where you believe this drive is from as it can point you where to look for conviction. Given I’m dubious, I think the slide will be short-lived.
Twitter Poll: What Drove Gold’s Sharp Decline?
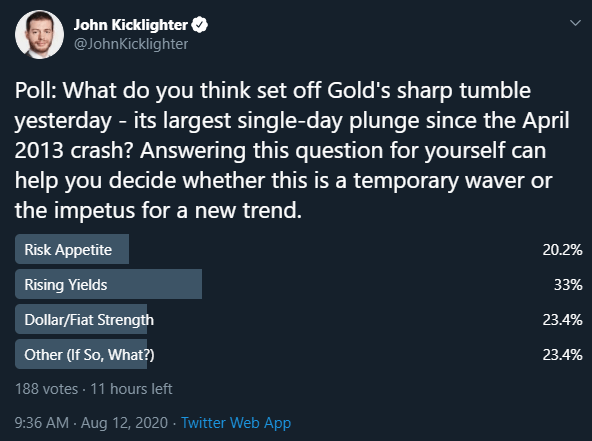
Poll from Twitter.com, @JohnKicklighter
Discerning the motivations of the masses can be difficult. Investors won’t offer up their collective reasoning, which can leave us to uncover an underlying current that is not obvious to even those participating. However, the fact remains that the volatility of this market remains exceptional. While the metal eased up from its dive this past session, it still cut a remarkably volatile candle. Naturally, the average true range (ATR) as a measure of realized volatility is exceptionally high. In such a state dramatic changes of direction or sudden acceleration are highly probable.
Chart of Gold with 20-Day Moving Average, 3-Day ROC and 3-Day ATR (Daily)
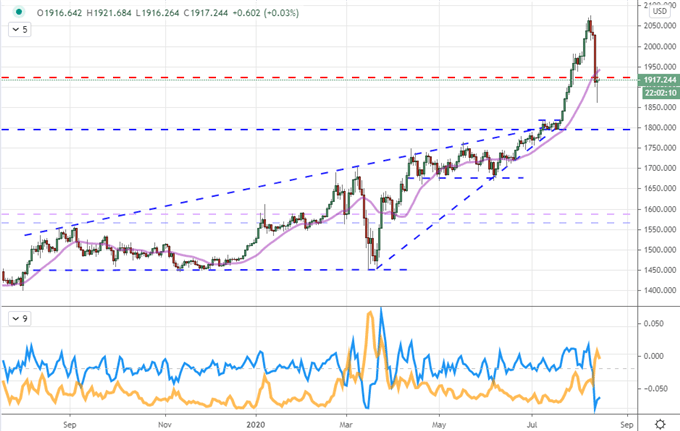
Chart Created on Tradingview Platform
Dollar Pairs Sticking to Their Ranges
As more explicit risk assets try to sort their convictions and gold exhibits remarkable volatility, there is a reasonable segue into the potential of the Dollar. The DXY Dollar Index fell back from its most recent, unsuccessful attempt to overrun 94 and further solidify the range between that ceiling and a floor of roughly 92.55. This is not acting as a safe haven but rather the accumulative issues of localized pressure from stimulus struggles (ongoing), coronavirus cases (easing somewhat), growth forecasts (leveling out) and geopolitical uncertainties (awaiting new sparks with China or election cycle surprises).
Twitter Poll: What Dollar Pair is Most Suited for Range Trading?
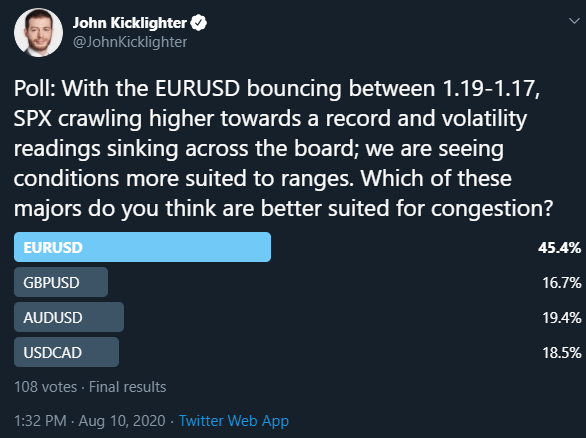
Poll from Twitter.com, @JohnKicklighter
Among the majors, EURUSD is still the favorite range vehicle for those that I polled on the matter of preferred Dollar-based major, but there are some interesting pictures – fundamentally and technically – elsewhere. The GBPUSD is leaning heavily on 1.3000 after this past session’s report that the UK economy is in the midst of its worst recession on record – and the worst among the major developed world players at the moment. Nevertheless, support is holding.
| Change in | Longs | Shorts | OI |
| Daily | 3% | -7% | -3% |
| Weekly | 4% | -10% | -5% |
Chart of GBPUSD with 20-Day Moving Average (Daily)
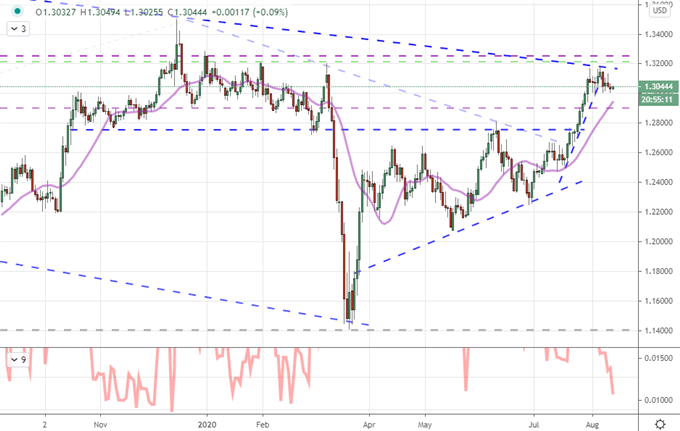
Chart Created on Tradingview Platform
Further, a fundamental charge followed the NZDUSD considering the RBNZ announced it was escalating its stimulus program and suggested in no uncertain terms that it wanted the Kiwi to drop from current levels. While the cross did technically break its trendline support, there remains conspicuously little follow through. It could be that these pairs are just waiting for the Dollar’s allowance to enter trend, but the Sterling and Kiwi are not marking good pace individual in other crosses. So what sets these markets back on trends?
Chart of NZDUSD with 20-Day Moving Average (Daily)
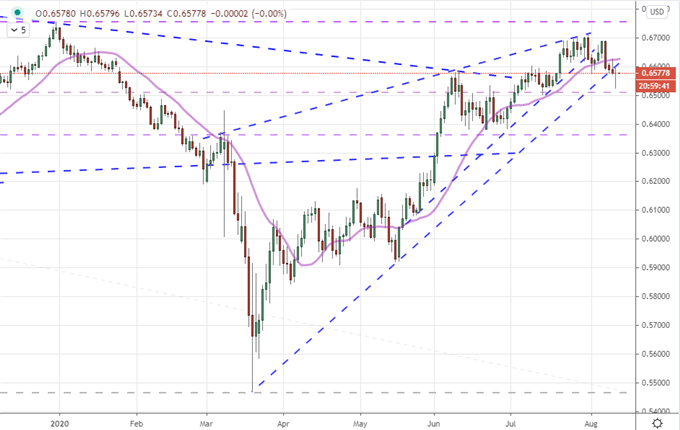
Chart Created on Tradingview Platform

If you want to download my Manic-Crisis calendar, you can find the updated file here.
.


