


S&P 500, Dollar, EURUSD, GBPUSD Talking Points:
- The S&P 500 posted its first bearish day in 8 trading session, but reversal pressure from this statistical exception doesn’t have a strong track record for reversal
- Meanwhile, the Nasdaq 100’s ratio to the Dow has signaled its second sharpest three-day tumble since September 2008 – a signal of speculative retreat
- A Dollar recovery has wavered, Gold’s turn has exploded while the Pound and Kiwi Dollar are waiting for their own fundamental signals
A Long Overdue Break In a Persistent Rally Does Not Signal Collapse
Statistically speaking, the pull back from the S&P 500 this past session is remarkable. After seven consecutive days of advance, this benchmark of speculative appetite finally put in for a red candle. Historically, advances of this consistency are unusual and so deserve closer observation. That said, these same instance at previous periods in history have not more often than not played out as a brief pause and break of tempo but not the start of a full reversal. A consideration of difference in current conditions is the fact that the current pause happened just shy of tagging a new record high. Yet, with the uncertainty over what fundamental theme is in firm control of sentiment; it is unlikely that conviction is any closer at hand.

Chart of S&P 500 with 20-Day Moving Average and Consecutive Candles (Daily)
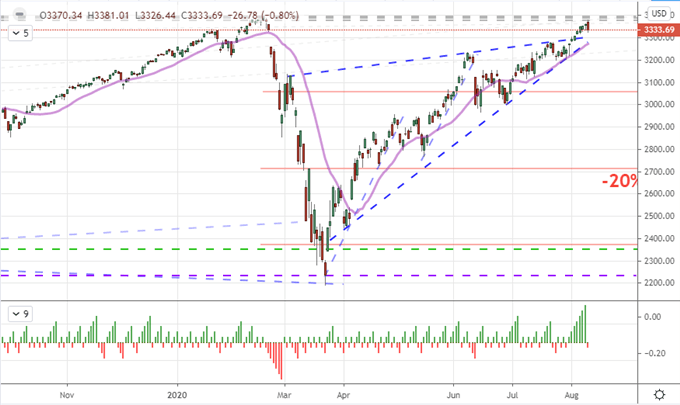
Chart Created on Tradingview Platform
Looking beyond the technical development form the US indices this past session, it was worth noting that the DAX Index actually broke above near-term resistance at 12,800 and the Nikkei 225 was hugging 23,000 resistance. That simply indicates that the jog lower happened after the European close. That said, there are few signals of full capital flight. One area that I will watch closely however is the slump in a concentrated sentiment preference in the Nasdaq 100 and tech shares. In fact, this top performing area of an already leading asset class (US equities) suffered its fastest three-day drop relative to the blue chip Dow since March 26 without comparison before that event until September 2008. Trouble may be brewing for confidence yet; but look for conviction.
Chart of Ratio Nasdaq to Dow with 3-Day Rate of Change (Daily)
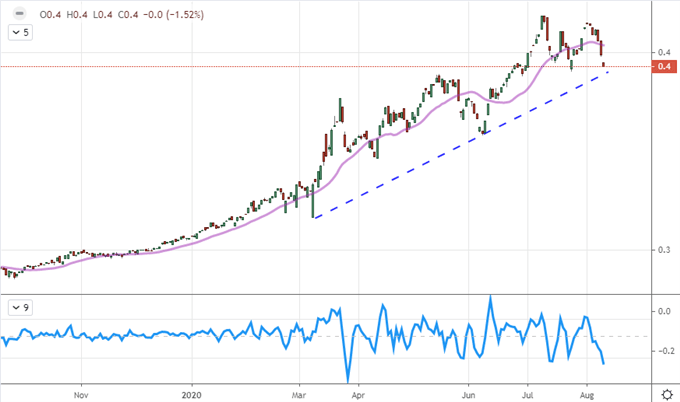
Chart Created on Tradingview Platform
The Biggest Drop in Gold in 7 Years - The Top?
Gold plummeted -5.7 percent this past session for the largest single day decline from the precious metal since April 2013. That is a telling comparison as the two-day collapse from the commodity just over 7 years ago represented a staggering -15 percent drop. Naturally, such a reference has many extrapolating comparisons – particularly given that performance relative to the peak that was struck and left in September 2011. Is this the market’s calling a top again? Certainly, the downdraft was an extraordinary one and truly befitting the incredible rally this past week to record highs. Consider spot had outpaced its 20-day moving average at the fast pace since February 2016 – a fairly good measure of technical over-extension. Yet, a trend reversal is not just a spark on a chart.
Chart of Gold with 20-Day Moving Average, 1-Day ROC and 20-SMA Disparity (Daily)
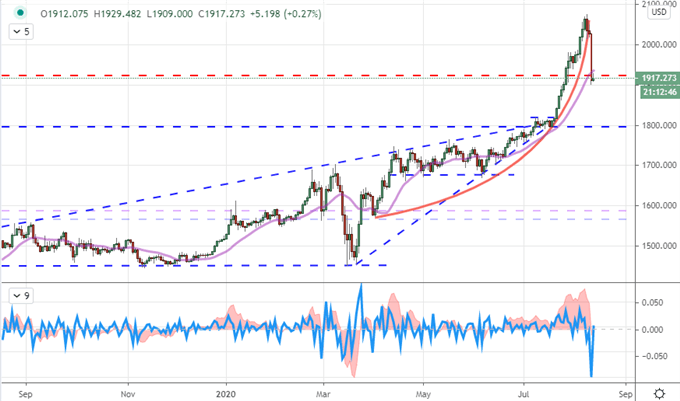
Chart Created on Tradingview Platform
One of the commanding drivers of the precious metal this past year in particular is the swell in accommodative monetary policy by the world’s largest central banks. This drive to offset recession and ensure financial stability also suppresses rates of returns in capital assets and further encourages excess risk taking. That makes for an unstable risk backdrop where practical hedges become more appealing. Further, since stimulus is denominated in the principal currencies around the world, appetite for an alternative to traditional ‘fiat’ is also fostered. That is why, I don’t see the correlation between gold and total stimulus as coincidental but rather causal.
Chart of Gold and Aggregate Balance Sheets of Fed, ECB, BOE, BOJ, PBOC in Dollars (Monthly)
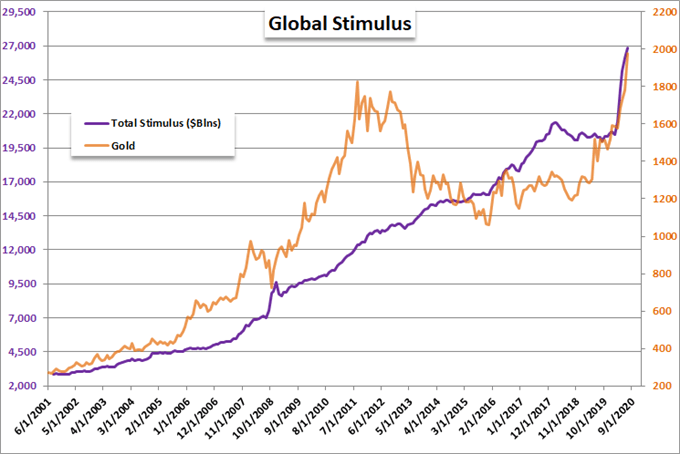
Chart Created by John Kicklighter with Data from Bloomberg
Dollar Registers the Loss of Fundamental Traction at an Inconvenient Time
For fundamental charge this past session, there was a notable theme of disappointing sentiment measures. Australian business, Japanese economic, Eurozone investor and US business confidence surveys all disappointed in one way or another in their respective updates. If the market were giving symmetrical weight to surprises, that could have been the prompt for serious reflection. And yet, risk trends didn’t budge. Perhaps the more systemic headline was yet another day passing without Congress coming to a compromise on a follow up stimulus, leaving the uneven executive orders as an uncertain prop for an ailing economy. With the Dollar struggling for lift off in its reversal, the loss of drive may align to technical barriers such as EURUSD’s range floor around 1.1700.
| Change in | Longs | Shorts | OI |
| Daily | -1% | -4% | -3% |
| Weekly | 4% | -10% | -5% |
Chart of EURUSD with 20-Day Moving Average and COT (Daily)
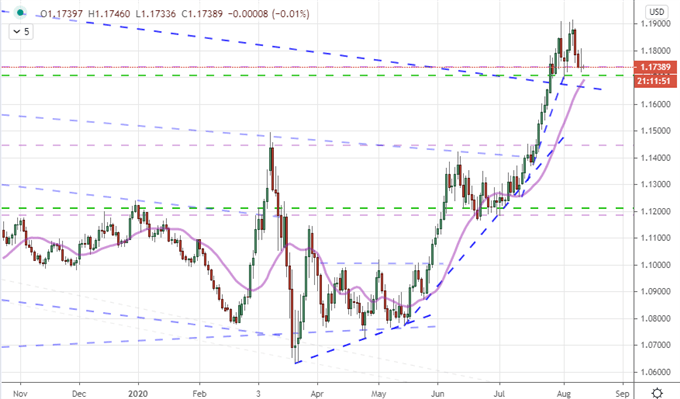
Chart Created on Tradingview Platform
Other Dollar crosses certainly qualify for the same struggle for the Greenback to fully commit to momentum, but there will be crosswinds that may pick up the responsibility for substantial movement. For GBPUSD, the UK employment statistics didn’t signal concern in the worst run of job losses in many years nor did it offer any relief not sinking as quickly as anticipated. The 2Q GDP update coming at the start of the London session may urge some more definitive interpretation. For those interested in Cable, observation of other Pound crosses (like EURGBP) would be wise.
| Change in | Longs | Shorts | OI |
| Daily | 3% | -7% | -3% |
| Weekly | 4% | -10% | -5% |
Chart of GBPUSD with 20-Day Moving Average (Daily)
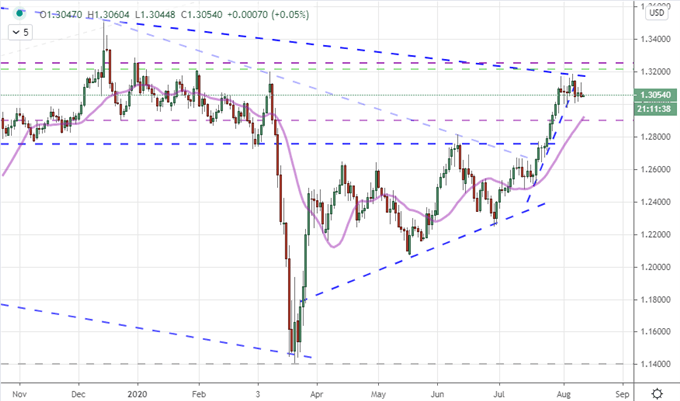
Chart Created on Tradingview Platform
Another particular USD pair to watch through Wednesday is NZDUSD. The RBNZ rate decision issued a clearly dovish warning with an escalation in the large scale bond purchase program to the tune of NZ$100 billion while also warning that negative rates are a distinct probability. Stimulus in other large countries have acted as boon to lift foreign investors’ confidence in economies backed by significant support, but this small country has found much of the international interest in its financial system through its carry trade role in one form or another. This may see the old formula of more stimulus translating into a weaker currency returned. With NZDUSD trading through a trend channel support and AUDNZD clearing a long-term range resistance, has the Kiwi fully capitulated?
Chart of NZDUSD with 20-Day Moving Average (Daily)
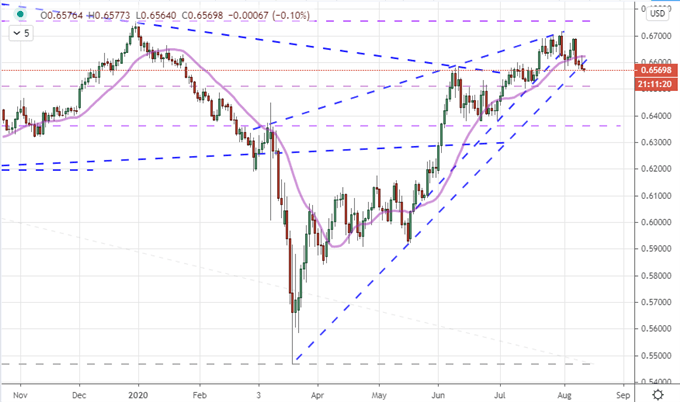
Chart Created on Tradingview Platform

If you want to download my Manic-Crisis calendar, you can find the updated file here.
.


