


Gold Technical Price Outlook: XAU/USD Near-term Trade Levels
- Gold price updated technical trade levels – Daily & Intraday Charts
- XAU/USD risk for larger correction while below 2034- key support 1876
- New to Gold Trading? Get started with this Free How to Trade Gold -Beginners Guide
Gold prices have plummeted more than 6% off fresh record highs with XAU/USD breaking below the August open today. The sell-off threatens a larger reversal in the days ahead but keeps prices within the confines of the broader yearly advance. These are the updated targets and invalidation levels that matter on the XAU/USD technical charts in the days ahead. Review my Weekly Strategy Webinar for an in-depth breakdown of this gold trade setup and more.
Gold Price Chart - XAU/USD Daily

Chart Prepared by Michael Boutros, Technical Strategist; Gold on Tradingview
Technical Outlook: In my last Gold Price Outlook we noted that XAU/USD had, “extended into a zone that could interrupt the immediate advance at uptrend resistance– that said the focus is higher while above the median-line.” The rally continued to rip higher unabated in the following days with price pulling back just one day out of fifteen. The advance marked a massive red flag on Friday however with an outside-day reversal off fresh record high- just ahead of broader uptrend resistance.
The sell-off is poised to mark a third consecutive day with the decline now attempting to break below confluence support at the median-line / 1984. Subsequent daily support eyed at the 2011 swing high / 23.6% Fibonacci retracement of the yearly range at 1920/27 with broader bullish invalidation now raised to the 2011 high-day close at 1876.
Gold Price Chart - XAU/USD 120min
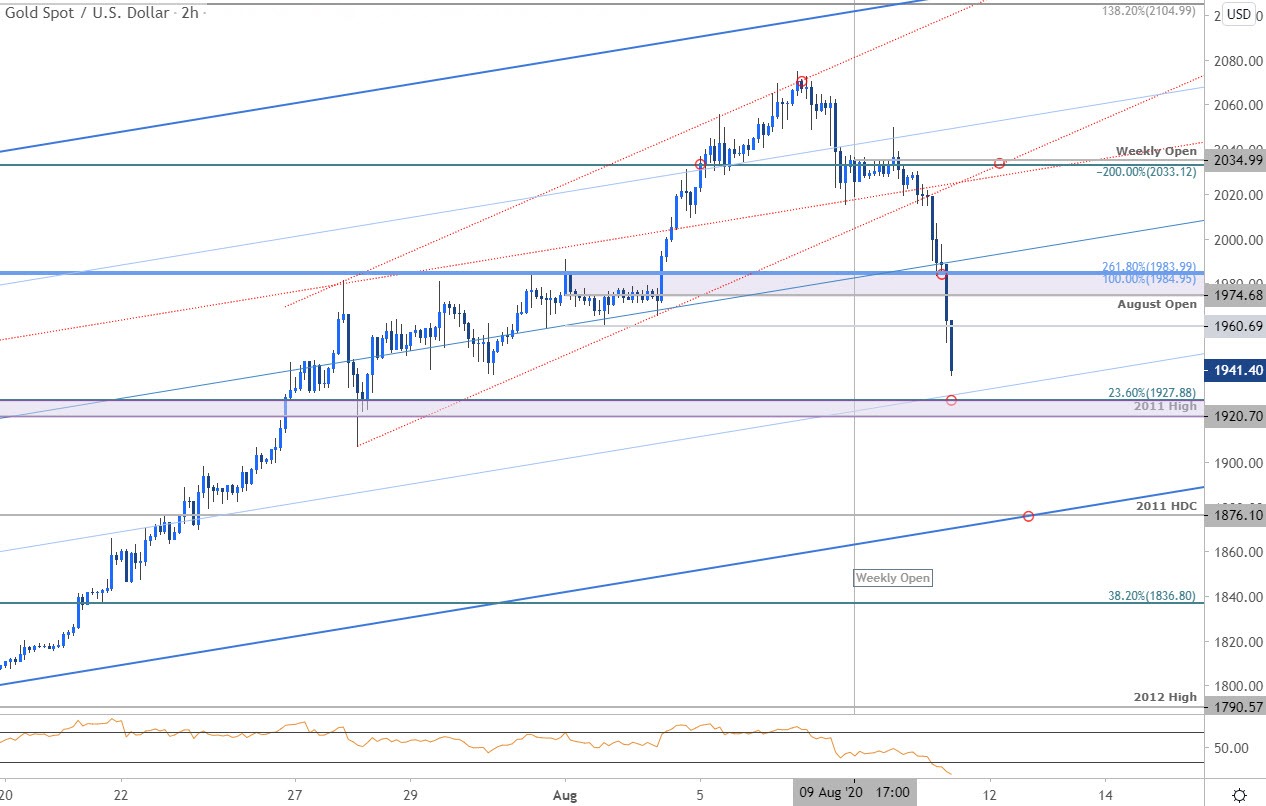
Notes: A closer look at Gold price action sees XAU/USD breaking below near-term channel support (red) early in the week with the decline now attempting to validate a break of the monthly opening-range lows at 1960. Initial resistance now stands back at the August open / Fibonacci confluence at 1974/84 with a breach above weekly-open resistance at 2035 needed to mark resumption of the broader uptrend towards the high close at 2066 and the 1.382% extension at 2105.

Bottom line: Gold prices remain at risk on the back of this recent stretch to record highs for a larger correction within the confines of the broader uptrend. From a trading standpoint, be on the lookout for possible downside exhaustion into the lower parallel / ahead of 1876 IF the broader long-bias is to remain viable. Ultimately a larger pullback may offer more favorable entries closer to trend support with a breach above this week’s open needed to fuel the next leg higher in price. Review my latest Gold Weekly Price Outlook for a closer look at the longer-term XAU/USD technical trading levels.
For a complete breakdown of Michael’s trading strategy, review his Foundations of Technical Analysis series on Building a Trading Strategy
Gold Trader Sentiment – XAU/USD Price Chart
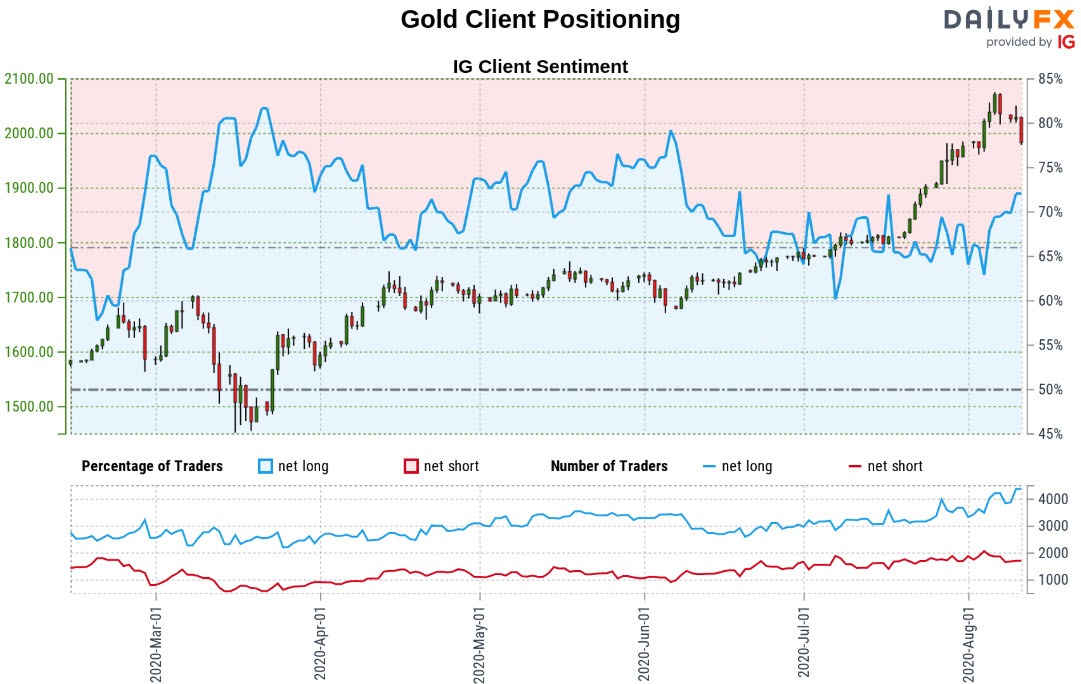
- A summary of IG Client Sentiment shows traders are net-long Gold- the ratio stands at +2.40 (70.63% of traders are long) – bearishreading
- Long positions are3.73% lower than yesterday and 11.66% higher from last week
- Short positions are 5.88% lower than yesterday and 12.89% lower from last week
- We typically take a contrarian view to crowd sentiment, and the fact traders are net-long suggests Gold prices may continue to fall. Traders are further net-long than yesterday and last week, and the combination of current positioning and recent changes gives us a stronger Gold-bearish contrarian trading bias from a sentiment standpoint.
| Change in | Longs | Shorts | OI |
| Daily | 1% | -3% | -1% |
| Weekly | 2% | -8% | -2% |
---
Active Trade Setups
- Dollar vs Mexican Peso Price Outlook: USD/MXN Range Breakout Imminent
- Canadian Dollar Outlook: USD/CAD Plummets to Major Uptrend Support
- Euro Dollar Outlook: EUR/USD Breakout Faces Key Fibonacci Resistance
- Australian Dollar Forecast: AUD/USD Breakout at Risk Below 2019 High
- Gold Price Outlook: XAU/USD Technical Breakout Eyes 2011 Record Highs
- Written by Michael Boutros, Technical Strategist with DailyFX
Follow Michael on Twitter @MBForex


