


S&P 500, Dollar, EURUSD, AUDUSD Talking Points:
- Risk trends continued to chop through the week with the S&P 500 carving out its smallest daily range since February 14th – a inauspicious sign given the backdrop
- Themes of recession, pandemic, political uncertainty and more provide too many distractions with an abundance of volatility but not much allowance for trend
- The Dollar’s reversal through the end of last week is stalling before it even got off the ground as the stimulus discussion draws on and key economic data
Where Some See a Bullish Bias, I See Pressure for an S&P 500 Break
In the most technical of terms, the S&P 500 advanced this past session. With a fresh five-month high that is slowly closing the gap formed with the careening lower back in mid-February, bulls looking for validation could readily seize on these stats. But it is hard to register true conviction from this ‘risk’ proxy when I look at the general shape of the benchmark’s chart and its recent level of inactivity. The recovery phase from the March 23rd reversal fits into a phased advance that is also broad congestion – a rising wedge formation. Most remarkable to me though is the degree of ‘quiet’ we have seen in activity so far this week. This past session’s SPX daily range is the smallest dating back to February 14th and Monday’s session was comparable. Rather than returning to a stoic norm, this seems more like pressure build up until one of the many competing systemic themes take traction.

Chart of S&P 500 with 20-Day Moving Average and 1-Day ATR Percentage of Spot (Daily)
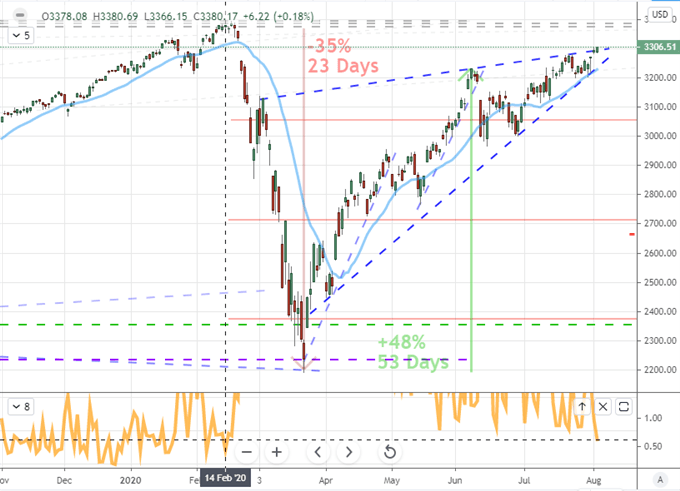
Chart Created on Tradingview Platform
The US index could readily break in either direction; but conviction is a different matter entirely. The market realization for conviction is momentum or follow through. While prevailing winds seem to still carry speculative markets higher, the list of factors that could spark untapped enthusiasm is low in my book. That is a probability versus potential consideration. When evaluating how to approach the situation, it is important to consider these general conditions. If we didn’t consider the backdrop, a DAX 30 break above 12,800 or reversal from that same former-support-as-new-resistance would seem equally potent. However, I don’t put nearly as much weight in the technical boundary as the prompt that decides its fate.
Chart of Germany’s DAX 30 Index with 20-Day Moving Average (Daily)
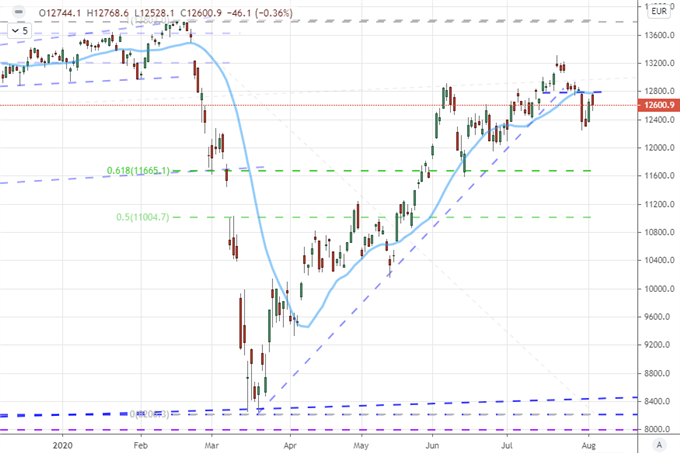
Chart Created on Tradingview Platform
Market Potential Around Vaccine Hopes and US Stimulus
If we are looking for risk-leaning themes that can genuinely boost the market, the list is increasingly short. A sudden and wholesale return to a tempo-ed economic growth is an impractical expectation. It would likely arise from promise from a catalyst. A vaccine to the Covid-19 pandemic could alleviate considerable uncertainty, but there has been excessive enthusiasm around the permanent medical solution. Nowhere is that more apparent than the share prices of the companies working on therapeutics and vaccine. Gilead’s struggle these past weeks is an example but Kodak is perhaps the ideal representation given the crush into the stock on reports of its ventured left turn followed by an SEC investigation and a practical review of its role to play. In general, there is likely considerable optimism built into the market on the basis of a near-term resolution to the contagion, but the realities of timelines, distribution and permanent after effects make this a serious candidate for the ‘buy the rumor, sell the news’ parable.
Chart of Kodak and Gilead in Purple (Daily)
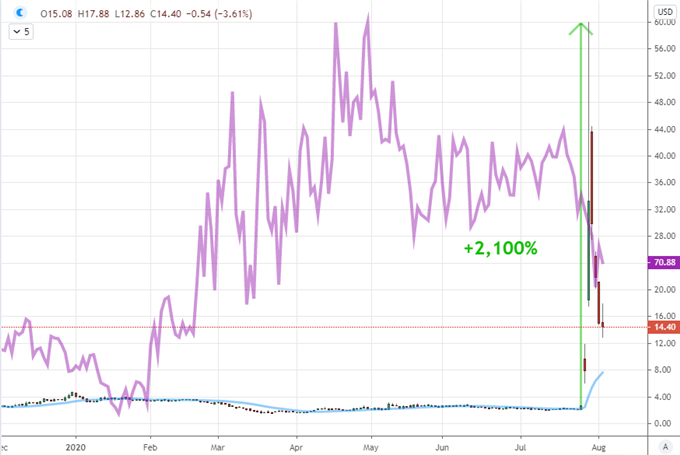
Chart Created on Tradingview Platform
Another theme that seems to be an outlet for further risk appetite should it come to pass is the possibility of the United States government announcing a replacement to the expiring CARES Act. According to leaders in the negotiations, they are still far apart on a compromise; but they intend to continue discussion in the day and days ahead. When or if it does come to pass, will it be more influential than the EU’s passage of its own 750 billion stimulus program where the DAX peaked shortly thereafter? One area where the potential may be more balanced is via the Dollar. A relative US improvement or deterioration in handling the pandemic and stimulus developments could either extend the tumble or encourage a short-term recovery depending on the outcome.
Twitter Poll: ‘What Do You Think is Driving the Dollar?’
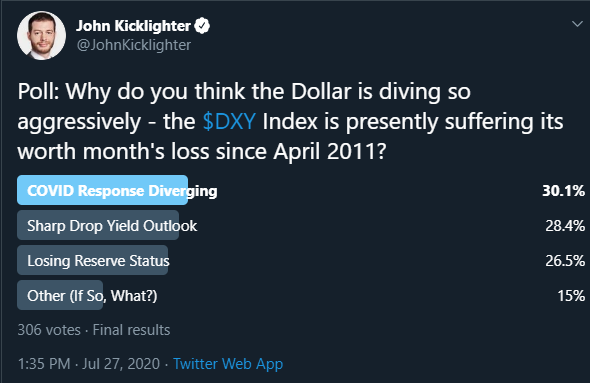
Poll from Twitter.com, @JohnKicklighter Handle
Aligning Dollar Technicals to Dollar Fundamentals
Just as I mentioned in the more risk-centric assets above, the Dollar fundamental scenarios should be considered alongside the technicals. For EURUSD, the long-term break was already made when the pair overtook 1.1700/50 which stood as a 12-year channel top and overlapping Fib levels. Does that make it more difficult for the Dollar to mount a recovery? I doubt it, but qualifying a break back below 1.1700 is a lower risk tolerance approach for those unsure.
| Change in | Longs | Shorts | OI |
| Daily | -1% | -4% | -3% |
| Weekly | 4% | -10% | -5% |
Chart of EURUSD with Net Speculative Futures Positioning and Wicks (Daily)
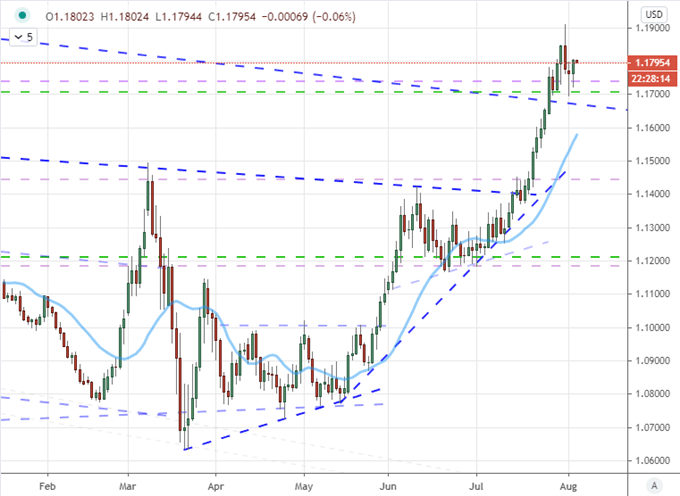
Chart Created on Tradingview Platform
Alternatively, AUDUSD hasn’t cleared the upper threshold of its general resistance (the 38.2% Fib of the pair’s historical range around 0.72). The chart seems to give greater balance to a break in either direction given a narrow trading band. I will note however that this pair is enjoying a strong positive correlation to risk yardsticks (the S&P 500 below), influences may transfer. Purely from the Dollar’s position, there is event risk on tap ahead. The June trade balance and ADP July private payrolls from the US are worth registering, but the service sector activity report from the ISM is the more timely and weighty growth update. Even then, it is still likely to struggle in mustering any full-tilt conviction.
| Change in | Longs | Shorts | OI |
| Daily | 2% | 3% | 2% |
| Weekly | 29% | -46% | 0% |
Chart of AUDUSD with S&P 500 (Daily)
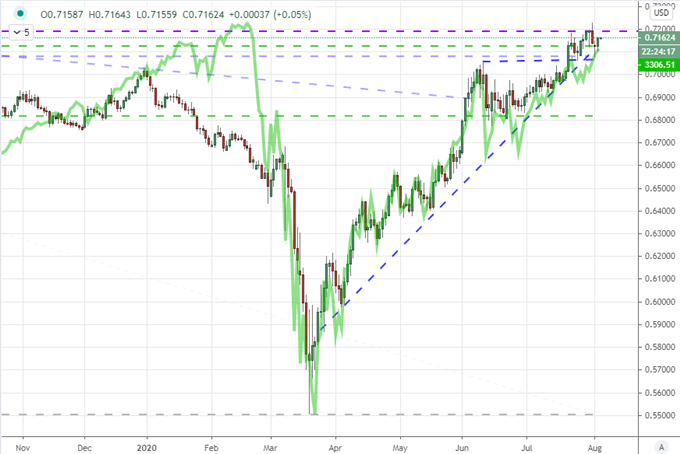
Chart Created on Tradingview Platform

If you want to download my Manic-Crisis calendar, you can find the updated file here.
.


