


NFP Talking Points:
- The S&P 500 holds the course of a false-break-reversal pattern, but follow through is unnervingly absent
- Fed policy, Hong Kong GDP and US-China trade questions will find a US reflection in data Friday (NFPs, trade, ISM service activity)
- Oil proved one of the global market's biggest movers, but motivation matters far more in the hold or break of the 200-day SMA
What do the DailyFX Analysts expect from the Dollar, Euro, Equities, Oil and more through the 2Q 2019? Find our forecasts for the quarter in the DailyFX Trading Guides page.
The Rare Situation Where A Threatening Technical Pattern Can Override Fundamental Themes
Though I believe in both the major analytical techniques - fundamentals and technicals - each seems to play a more common role in the development of general market trends. Given that my baseline belief is that the price we experience is the reflection of the collective views of the many participants to a market, fundamentals usually draw my evaluation of conviction and thereby intent. While there are many speculators that operate through the charts alone, large markets like those of the FX, global equities and yield find far greater swaths of wealth being directed by financial institutions, management funds, central banks and other longer-duration and probability-dependent participants. Therein lies my logic for determining the top fundamental themes that can draw the most attention and capital flows to track ebb and flow. From there, the technicals play the role of offering milestones for which progress can be measured, reasonable objectives can be evaluated from historical activity and viable stops placed behind areas where it seems there is effort to beat back further development of trend. Yet, sometimes the balance of power flips. There are times when technicals themselves can exert inordinate power and override fundamental focus. We may be facing just such a period.
At present, many of the critical fundamental themes for which we have kept track are still unresolved. That said, there is also a lack of direction and momentum to their evolution. From the health of the economy - or 'growth' - we continue to register troubling signals of an relinquishing course of deceleration. The most recent example of this was Hong Kong's 1Q GDP reading (0.5 percent) which hit an approximate decade low pace to add further concern over Asia's health. Then again, many of the forecasts we have seen from central banks and governments have been raised, while the US has teased hope/enthusiasm with the revived discussions of a $2 trillion infrastructure spending program. Trade wars are still in place, the EU has a few open threats against it from the US and President Trump is due to make some call on auto tariffs on March 15th. Then again, there is very clear insinuation that a deal could come in the US-China negotiations by end of next week. As for monetary policy, the improbability that they can staunch any future fires hasn't changed, but the pressure they are facing to test this has nevertheless eased. This leaves us in a state of uncertainty though still burdened by anxiety. It is in this environment where a meaningful speculative shift can leverage far more market movement of its own volition than what it normally would be capable.
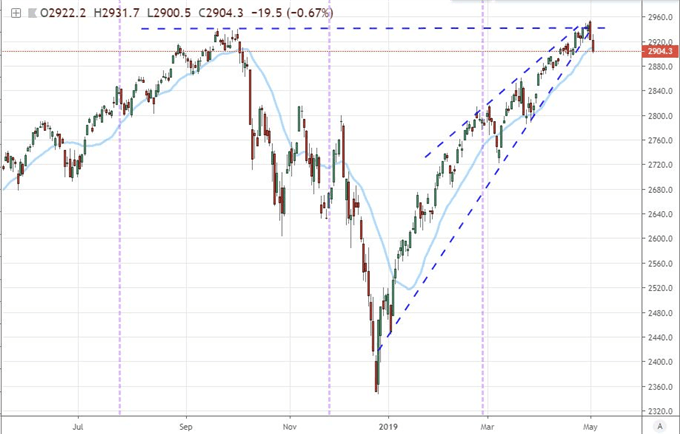
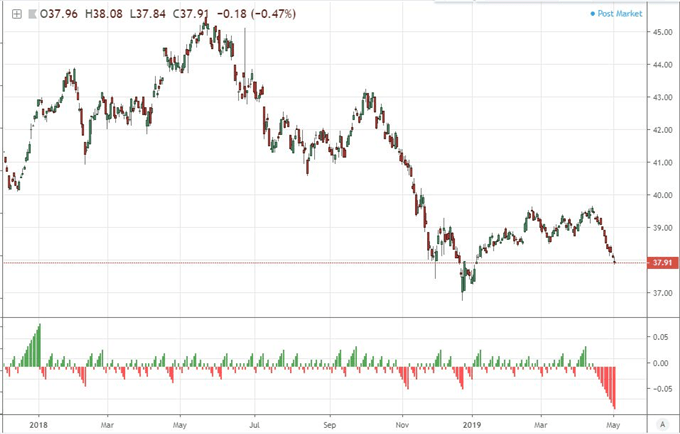
Thus, the technical position of the S&P 500 leverages an unusual amount of potential. The most heavily-traded (via derivatives and cumulative spot) equity index in the world, in the most popular asset class in the world, from the largest country in the world; the US benchmark is already sporting inordinate levels of influence. Having outperformed its most prominent counterparts across region and asset class this past decade, it only furthered its standing as the baseline for risk trends. Now, as we see the effort to break and explore record highs fall apart and a subsequent reversal take hold, we are seeing an idol of sentiment itself falter at the threshold of unconstrained bullishness and follow a path of least resistance back into a wide range that can carry with it more sense of risk aversion that we would otherwise expect from it alone. The stakes are high and attention is intense.
Chart of the S&P 500 and the 20-day Moving Average (Daily)
A US Docket That Will Manage to Reflect on Growth, Trade and Monetary Policy Themes
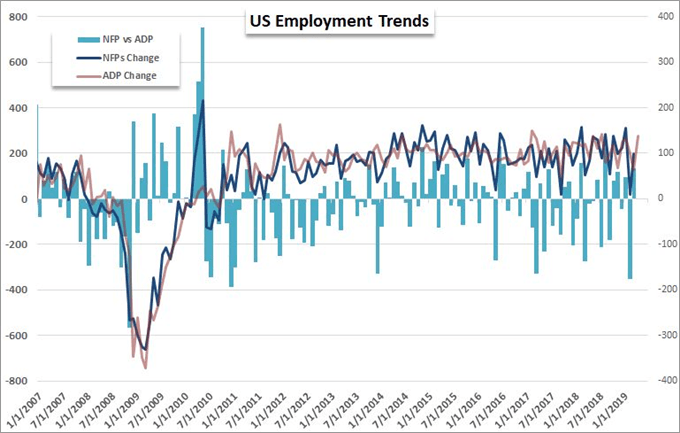
Already, the US has found itself in a position of inflated influence this week between the global reach of the FOMC rate decision Wednesday and the precious situation the S&P 500 finds itself. Yet, we may see this pressure further intensify through the final trading session of the week given the top listings on the US economic docket. There are events that will cover all three of the aforementioned systemic themes in one form or another. Obviously, the top listing for headlines and immediate market-moving potential will be the monthly employment report. The change in NFPs is a favorite for financial media given its familiarity, its direct connection to economy and its influence over monetary policy. Given the surprise language from Powell on Wednesday and the market's reaction to his rhetoric, I'll be evaluating the event for the monetary policy perspective. In fact, the jobs data is good for both nodes of the Fed's dual mandate: steady inflation and healthy employment. The unemployment rate is near its natural low of the cycle and it will take time to truly reverse. Wage figures are the more sensitive measure on inflation with Powell's remarks freshly in mind.
Chart of Historical NFPs, ADP and the Difference Between the Two
On the topic of trade wars, we are waiting to see if the engagement between the US and China breaks while simultaneously keep a wary eye out for auto and European tariffs. In the meantime, we can measure the impact of the growth headwinds on the economy thus far through data that directly reflects the influence. The March advanced goods trade deficit is expected to widen even further to a -$73 billion shortfall. As for the general state of growth, there is still an afterglow from the 1Q GDP beat last week. It has certainly helped lift forecasts in certain important areas of the financial system. We have had some initial PMI figures from Markit for April that give the first steps into second quarter health, but the ISM's service sector activity report will offer greater weight than most other measures in this timely capacity. This non-manufacturing area accounts for more than three-quarters of economic activity and employment. Where goes services, so goes the US economy. While this will all fight the twilight hours of liquidity for the week, it will struggle to mount a serious Dollar movement. However, a significant reading from any of these three reports could generate far larger moves than traders may anticipate.
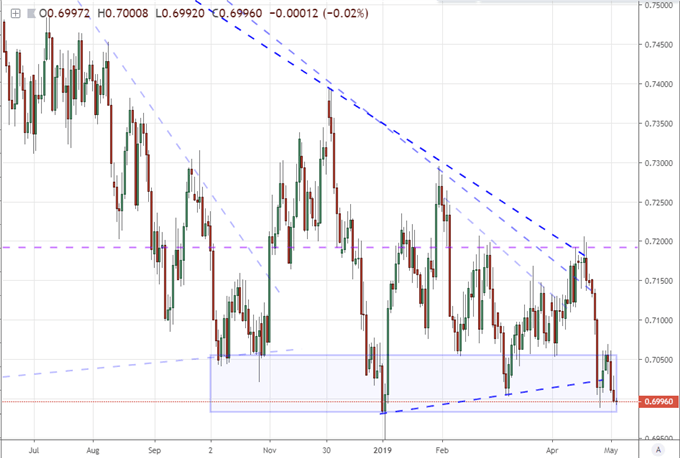
Chart of AUDUSD (Daily)
Crude Oil Takes Another Jog Lower and the Prospect of Reversal Materially Increases
For sheer anticipation, the British Pound held perhaps the most pressing interest among the major markets this past session owing to the Bank of England's (BOE) rate decision. The event would offer the policy decision, Governor Carney's press conference and the so-called Quarterly Inflation report. That makes for the Super Thursday that holds greater capacity to generate monetary policy-derived market movement. While there was no surprise from the fact that the central bank held its policy course unchanged, forecasts were unexpectedly shifted to the hawkish side. The GDP forecast for 2019 was raised from a 1.3 percent expansion to 1.6 percent. On monetary policy, Governor Carney - amid caution over the uncertainty posed by Brexit - said the market may underestimate the capacity of rate hikes moving forward. He said they could hike rates more than once over the coming three years as is being priced.
Where anticipation was low but actual market movement was extreme, crude oil suffered another sickening lurch lower. The commodity tumbled through 62.50 and undisputedly took out support on the rising channel defining 2019's market trend. While it is still a stretch to say a full-blown bear trend is underway, it is more difficult to argue against and a stretch to say this is a mere waver in a persistent bullish trend. There was plenty of supply-side talk to draw on for justification. An approximate 10-million-barrel jump in US supplies to the highest levels since 2017 while US production nudged up to a record 12.3 million barrels per day. On the other end of that talking point, the end of the Iranian wavers and ongoing output crunch on Venezuela theoretically imposes lift. Is this selective drive or perhaps something else? I believe the slip from the S&P 500 and other risk assets likely carries more weight in this equation. Commodities are a particularly growth-sensitive risk asset, but they have speculative connections nonetheless. That said the USCI commodity index has dropped for 13 straight trading days - the longest I have on record. It may not be a clear trend, but it is leaning in a different direction and gaining traction. We discuss all of this and more in today's Trading Video.
Chart of Crude Oil Overlaid with the S&P 500 (Daily)
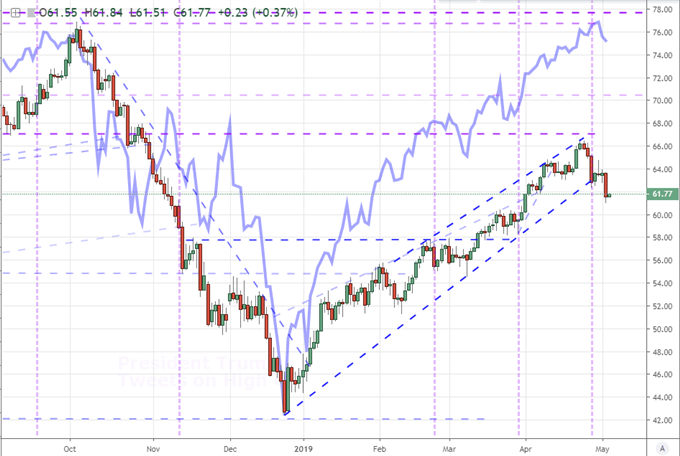
Chart of USCI Commodity Index and Consecutive Day Moves (Daily)
If you want to download my Manic-Crisis calendar, you can find the updated file here.


