


Gold Price Outlook:
- Gold prices have not been able to hold onto gains in a meaningful way.
- The technical structure remains weak as long as gold prices hold below the area around 1680.
- Gold prices have a mixed bias in the near-term, according to the IG Client Sentiment Index.

Aggressive Fed Weighs
In the wake of the September US inflation report (CPI) last week, Fed rate hike odds have shifted higher into 2023, with markets now discounting the main rate peaking near 5% - a meaningful shift higher from ahead of the CPI release, when the main Fed rate was priced to peak near 4.7% in 2Q’23. US Treasury yields and US real yields have turned higher anew, much to the chagrin of gold prices. These persistent fundamental obstacles are buttressing an already-weak technical structure that has not improved in recent days.
Gold Volatility Drops Alongside Gold Prices
Historically, gold prices have a relationship with volatility unlike other asset classes. While other asset classes like bonds and stocks don’t like increased volatility – signaling greater uncertainty around cash flows, dividends, coupon payments, etc. – gold tends to benefit during periods of higher volatility. Gold volatility has started to decline, even though US yields (both nominal and real) and the US Dollar remain elevated, creating a meaningful headwind for gold prices.
GVZ (Gold Volatility) Technical Analysis: Daily Price Chart (October 2021 to October 2022) (Chart 1)
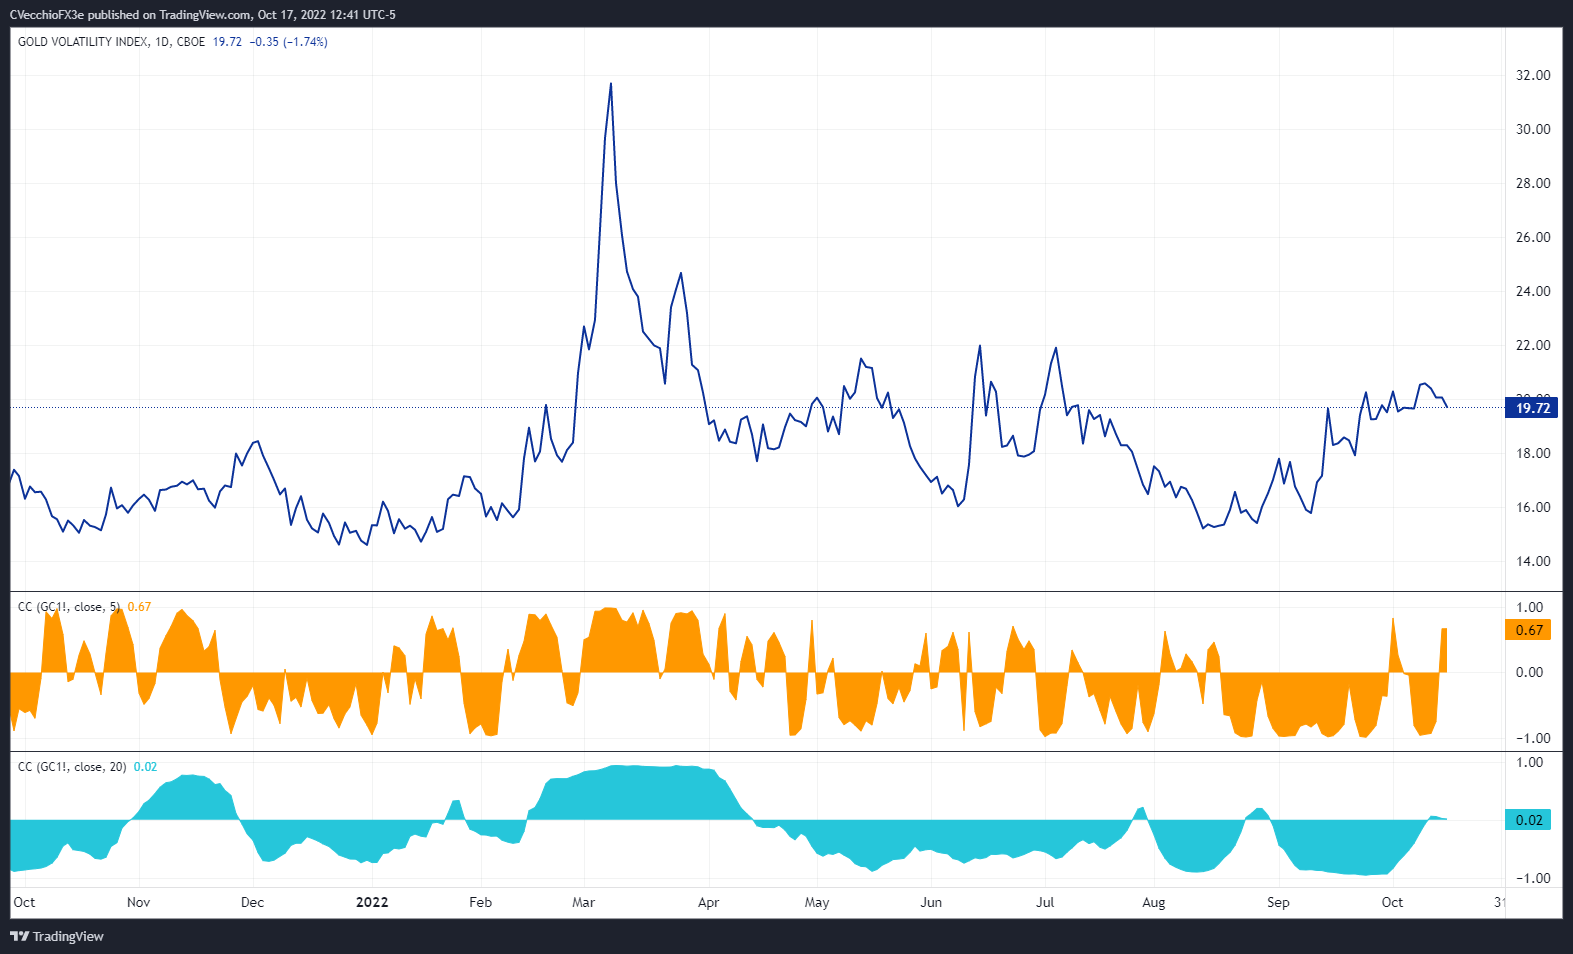
Gold volatility (as measured by the Cboe’s gold volatility ETF, GVZ, which tracks the 1-month implied volatility of gold as derived from the GLD option chain) was trading at 16.46 at the time this report was written. The 5-day correlation between GVZ and gold prices is +0.67 while the 20-day correlation is +0.02. One week ago, on October 10, the 5-day correlation was -0.96 and the 20-day correlation was -0.22.
Gold Price Rate Technical Analysis: Daily Chart (October 2021 to October 2022) (Chart 2)
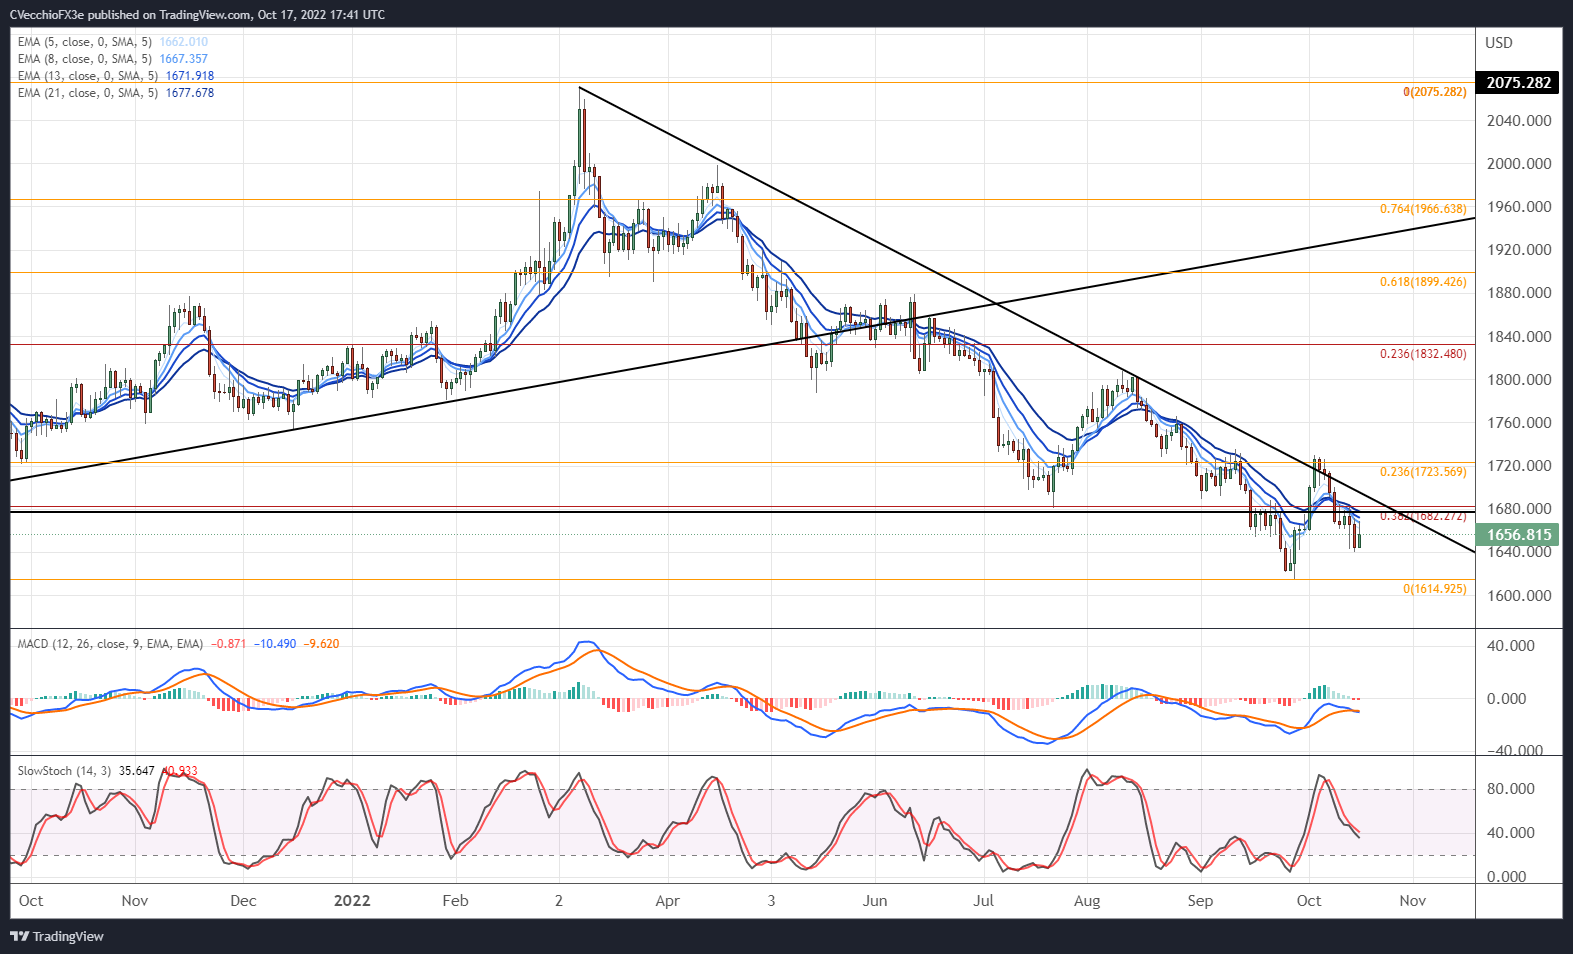
The hammer candle that appeared last Thursday found no follow-through thus far, bringing into question the validity of a near-term bottom. The rally by gold prices at the start of the week has started to fade, with bullion back below their daily 5-, 8-, 13-, and 21-EMAs, and the EMA envelope is in bearish sequential order. Daily MACD is trending lower below its signal line, and daily Slow Stochastics are slipping below their median line.
As noted last week, “another run to the descending trendline from the March and August highs is possible, but until the downtrend breaks, it’s difficult to have faith in a meaningful rally by gold prices.” A move above the area around 1680 by the end of October would see gold prices trade back above former multi-month support (turned resistance) and break the downtrend in place from the March and August highs. Until then, however, the path of least resistance is lower.
Gold Price Technical Analysis: Weekly Chart (October 2015 to October 2022) (Chart 3)
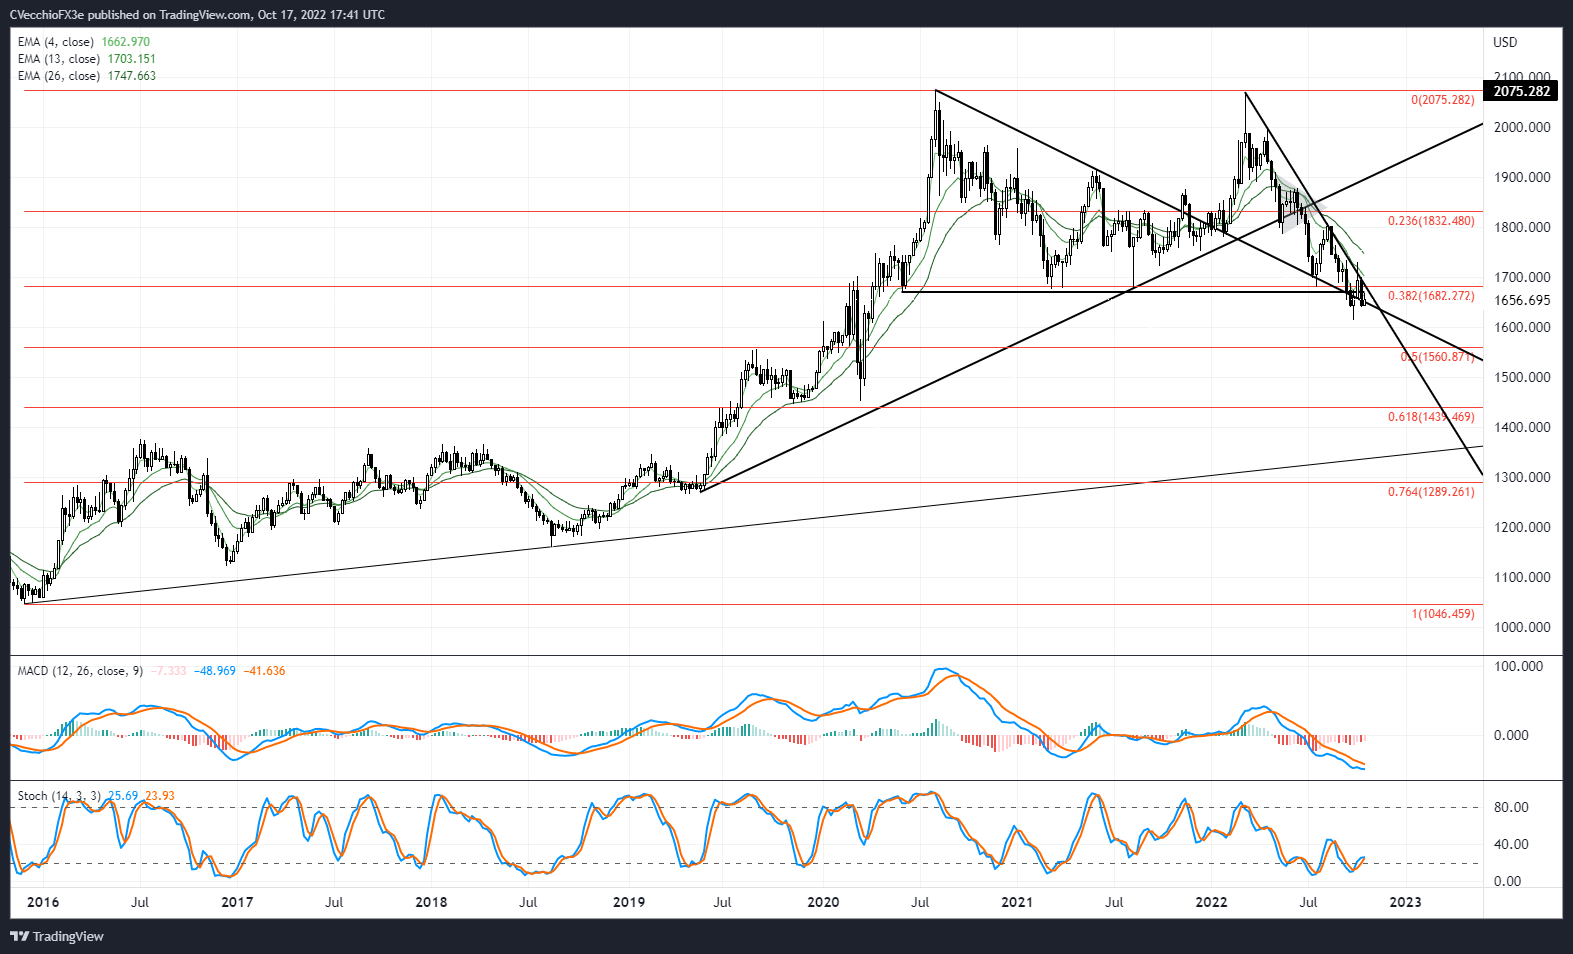
The longer-term view remains unchanged as no significant progress has been made on the weekly timeframe: “a double top remains in place, but a quadruple bottom around 1680 warrants a reconsideration: a massive sideways range between 1680 and 2075 may have formed. A bounce from 1680 sees 1800 as the first area before resistance is found. The sudden shift in the environment suggests that the daily timeframe (and lower, like the 4-hour timeframe) will be better suited to pay attention to over the coming days/weeks as it will take a long time for technical indicators to evolve on the weekly timeframe.”

IG CLIENT SENTIMENT INDEX: GOLD PRICE FORECAST (October 17, 2022) (Chart 4)
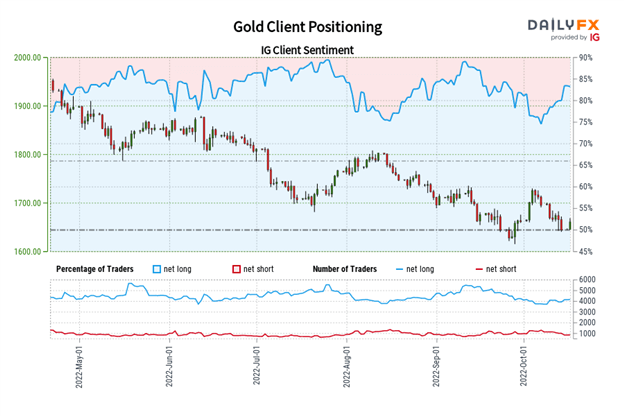
Gold: Retail trader data shows 79.48% of traders are net-long with the ratio of traders long to short at 3.87 to 1. The number of traders net-long is 0.02% higher than yesterday and 5.72% higher from last week, while the number of traders net-short is 29.05% higher than yesterday and 10.71% lower from last week.
We typically take a contrarian view to crowd sentiment, and the fact traders are net-long suggests Gold prices may continue to fall.
Positioning is less net-long than yesterday but more net-long from last week. The combination of current sentiment and recent changes gives us a further mixed Gold trading bias.
Trade Smarter - Sign up for the DailyFX Newsletter
Receive timely and compelling market commentary from the DailyFX team
--- Written by Christopher Vecchio, CFA, Senior Strategist


