


Gold Price Outlook:
- Gold prices have staged an impressive intraday rally post-US CPI, but ultimately remain within the downtrend from the March and August highs.
- Unlike the US Dollar (via the DXY Index) or US equity markets, gold prices haven’t been able to reverse their post-US CPI move entirely.
- Gold prices retain a bearish bias in the near-term, according to the IG Client Sentiment Index.

Inflation-Induced Volatility
The September US inflation report (CPI) surprised financial markets again, with stubbornly elevated inflation pressures. As a result, US Treasury yields and US real yields turned higher, boosting Fed rate hike odds, initially provoking a rally by the US Dollar (via the DXY Index) and a sharp decline by gold prices.
Nevertheless, there has been a significant reversal across financial markets today in the wake of the CPI reading. US equity markets rallied over +5% from their intraday lows, while the DXY Index swung into negative territory. Gold prices have rallied from their lows as well, but with US yields staying elevated on the session, bullion has not been able to shake off all of its losses. Accordingly, the weak technical structure remains in place.
Gold Volatility Remains Elevated
Historically, gold prices have a relationship with volatility unlike other asset classes. While other asset classes like bonds and stocks don’t like increased volatility – signaling greater uncertainty around cash flows, dividends, coupon payments, etc. – gold tends to benefit during periods of higher volatility. Gold volatility remains elevated, and in the context of higher US yields (both nominal and real) and a resilient US Dollar, it remains a headwind for gold prices in the near-term.
GVZ (Gold Volatility) Technical Analysis: Daily Price Chart (October 2021 to October 2022) (Chart 1)
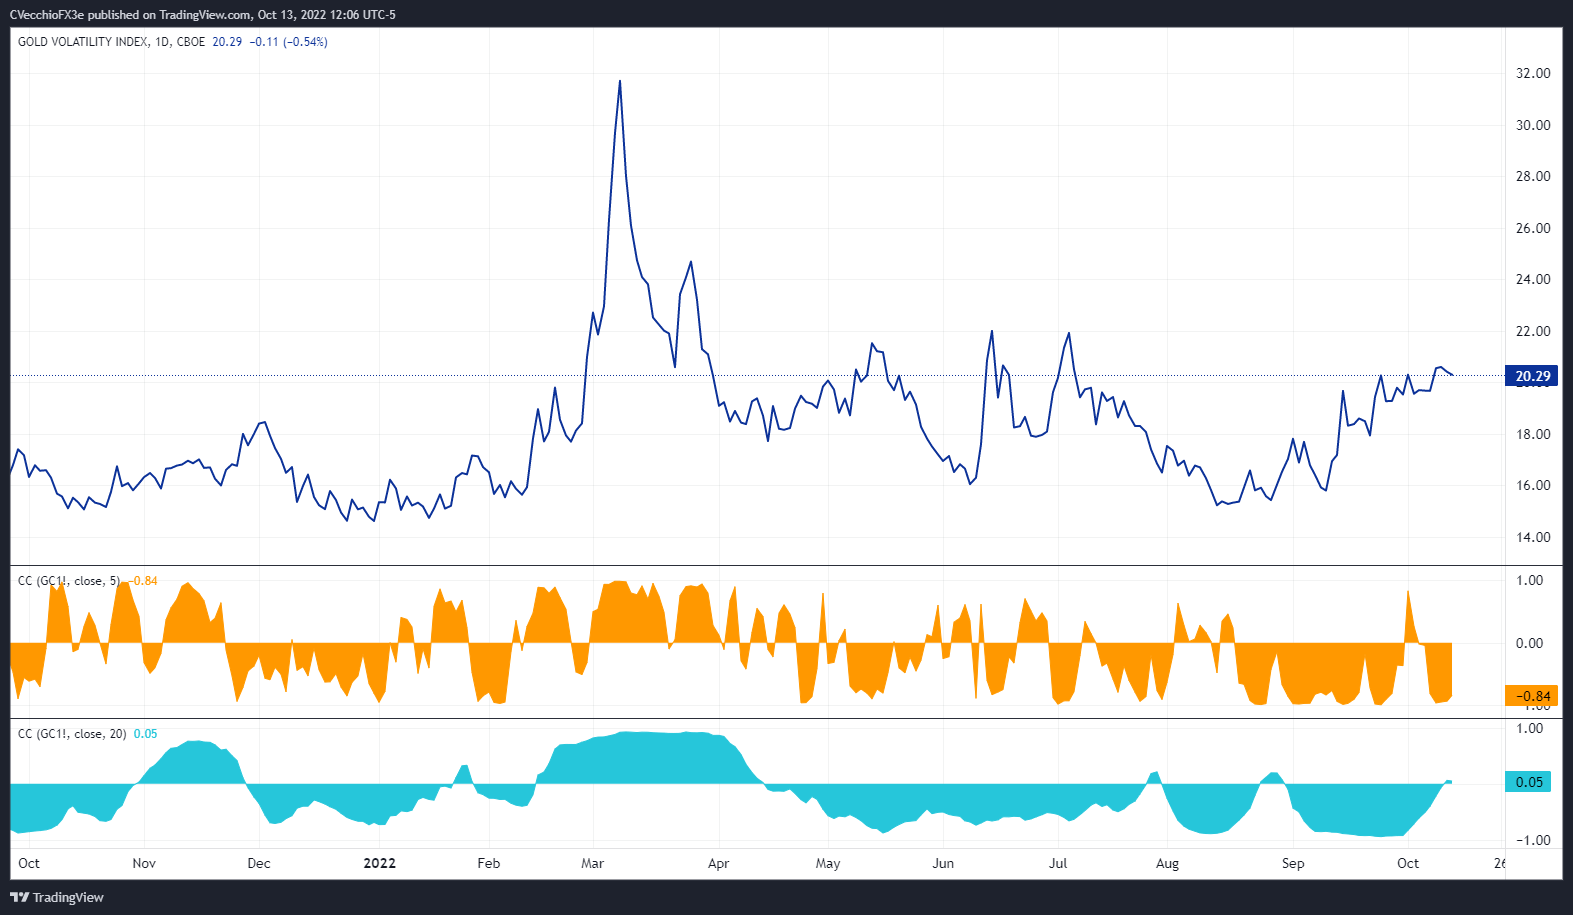
Gold volatility (as measured by the Cboe’s gold volatility ETF, GVZ, which tracks the 1-month implied volatility of gold as derived from the GLD option chain) was trading at 16.46 at the time this report was written. The 5-day correlation between GVZ and gold prices is -0.64 while the 20-day correlation is +0.05. One week ago, on October 6, the 5-day correlation was -0.04 and the 20-day correlation was -0.51.
Gold Price Rate Technical Analysis: Daily Chart (October 2021 to October 2022) (Chart 2)
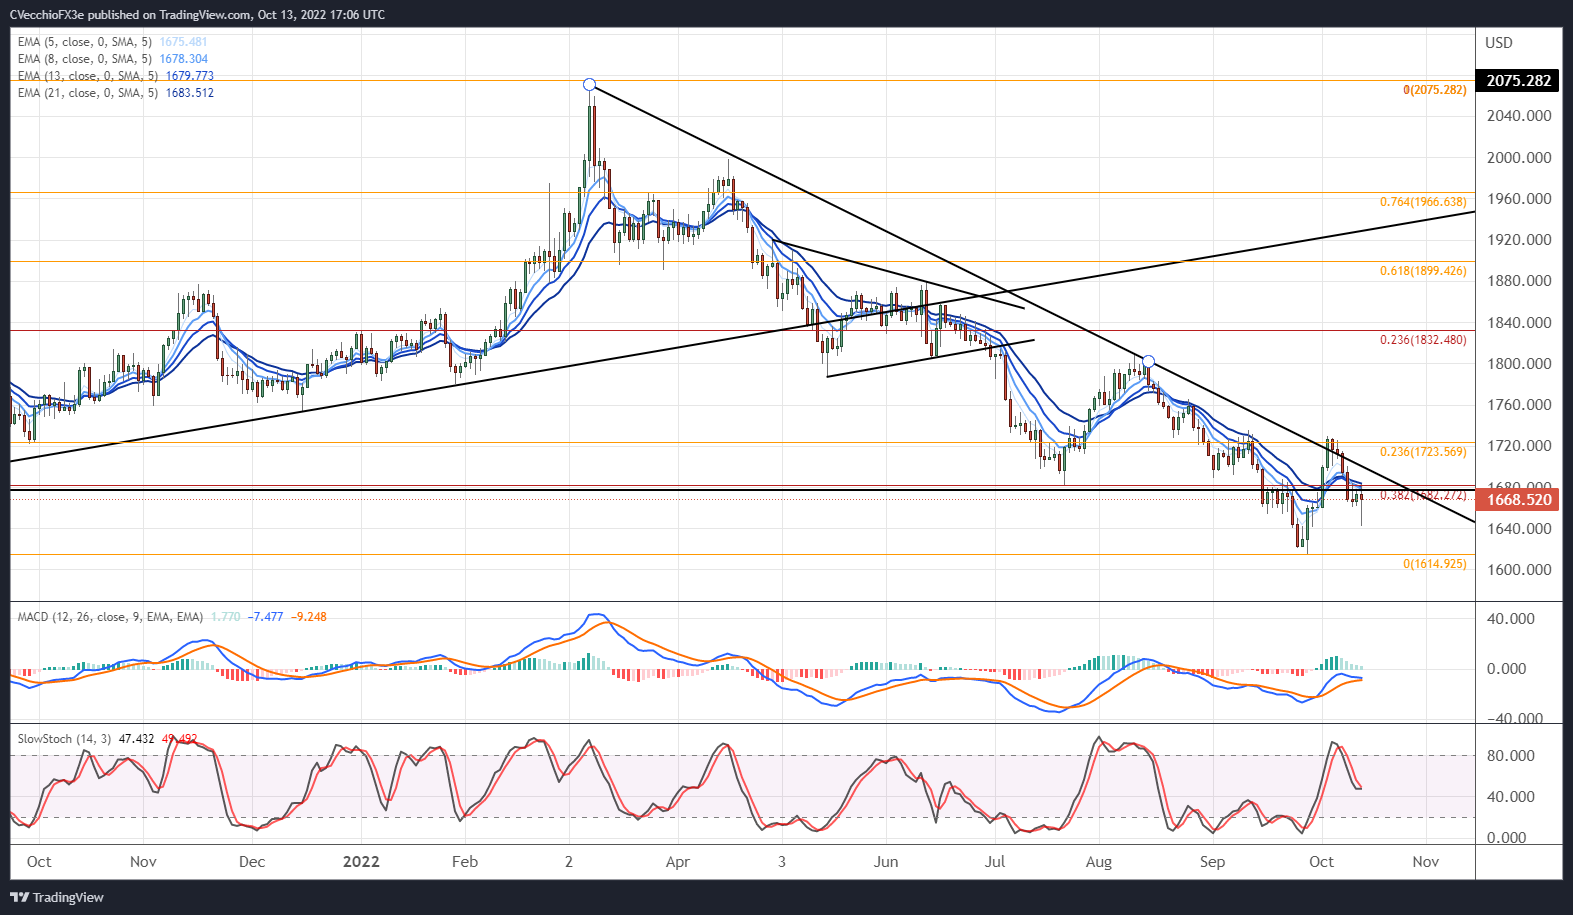
The intraday rally is setting up a hammer candle on the daily chart, suggesting that a near-term bottom may be in the process of being established. More technical evidence is required, however, as the broader structure of the gold price chart remains bearish. Gold prices are below their daily 5-, 8-, 13-, and 21-EMAs, and the EMA envelope is in bearish sequential order. Daily MACD is holding below its signal line, and daily Slow Stochastics are hovering their median line. Another run to the descending trendline from the March and August highs is possible, but until the downtrend breaks, it’s difficult to have faith in a meaningful rally by gold prices.
Gold Price Technical Analysis: Weekly Chart (October 2015 to October 2022) (Chart 3)
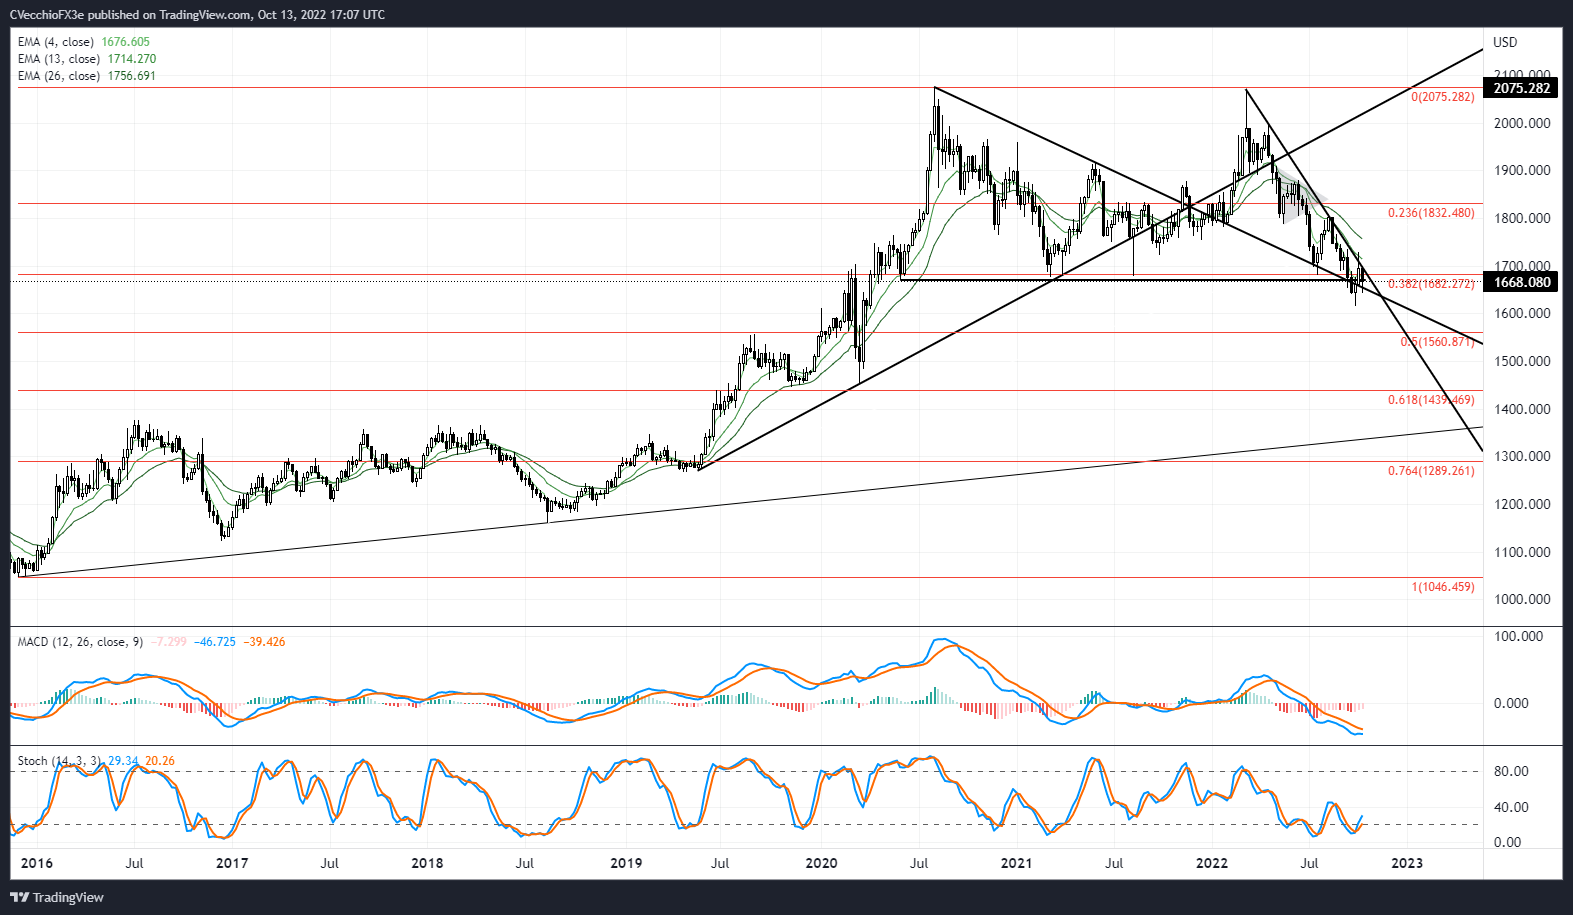
The longer-term view remains unchanged as no significant progress has been made on the weekly timeframe: “a double top remains in place, but a quadruple bottom around 1680 warrants a reconsideration: a massive sideways range between 1680 and 2075 may have formed. A bounce from 1680 sees 1800 as the first area before resistance is found. The sudden shift in the environment suggests that the daily timeframe (and lower, like the 4-hour timeframe) will be better suited to pay attention to over the coming days/weeks as it will take a long time for technical indicators to evolve on the weekly timeframe.”

IG CLIENT SENTIMENT INDEX: GOLD PRICE FORECAST (October 13, 2022) (Chart 4)

Gold: Retail trader data shows 80.53% of traders are net-long with the ratio of traders long to short at 4.14 to 1. The number of traders net-long is 3.36% lower than yesterday and 5.48% higher from last week, while the number of traders net-short is 14.44% lower than yesterday and 27.62% lower from last week.
We typically take a contrarian view to crowd sentiment, and the fact traders are net-long suggests Gold prices may continue to fall.
Traders are further net-long than yesterday and last week, and the combination of current sentiment and recent changes gives us a stronger Gold-bearish contrarian trading bias.
Trade Smarter - Sign up for the DailyFX Newsletter
Receive timely and compelling market commentary from the DailyFX team
--- Written by Christopher Vecchio, CFA, Senior Strategist


